tikzplotlib
 tikzplotlib copied to clipboard
histogram with log scale has display issues for small values
It seems matplotlib can not properly render histograms, when log scale is active for the y-axis and the absolute frequency is smaller than ~2.7, ie. 1 and 2.
The Python code:
import pandas as pd
import matplotlib.pyplot as plt
from matplotlib2tikz import save as tikz_save

plot_values = pd.DataFrame(
    {
        'test0': pd.Series([0, 0, 0, .1, .1, .2]),
        'test1': pd.Series([0, .1]),
    }
)
plot_values.plot.hist(stacked=False)  # Should not use stacked for log plot
plt.gcf().set_size_inches(4, 3)
plt.yscale('log')
plt.ylim(ymin=.1)

plt.savefig('/tmp/test_a.png')
tikz_save('/tmp/test_a.tikz')
The png looks fine:

However, from the pdf it seems histogram bars are plotted with their lower bound starting at ~2.7 (instead of -inf). This will especially cause issues when the frequency is 1 or 2.

Can you cook up an example code without pandas? It's such a heavy dependency...
I have a similar issue with my histogram while using a log scale on the y axis. The matplotlib version looks fine.
The .tex version has a similar problem as MarcoFalke described.
Matplotlib PNG Version:

.tex Version after compiling in latex:
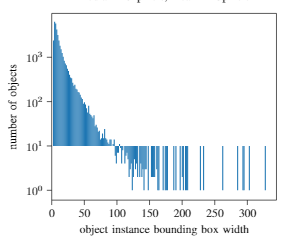
I have the same issue as @derbach. I solved it by manually replacing values in the tikz output file. The lower value for plotting a bar was set to 0, and I replaced it by 0.01. A bit dirty but it was enough in my case. e.g., \draw[draw=white,fill=color0,line width=0.32pt] (axis cs:1,0.01) rectangle (axis cs:2,13357);