pi-hosted
 pi-hosted copied to clipboard
[REQUEST] grafana
add grafana its a cool monitoring thing that can monitor whatever u want
Technically there's already Raspberry Pi Docker Monitor which is based on grafana. You can add your own dashboards ontop of that!
ok thanks.. but there is one problem and its that when i deploy the stack, only three of them is created, and the monitoring-grafana wont start, it just stays in [Created].. it also says limited control so probably gonna need help with that
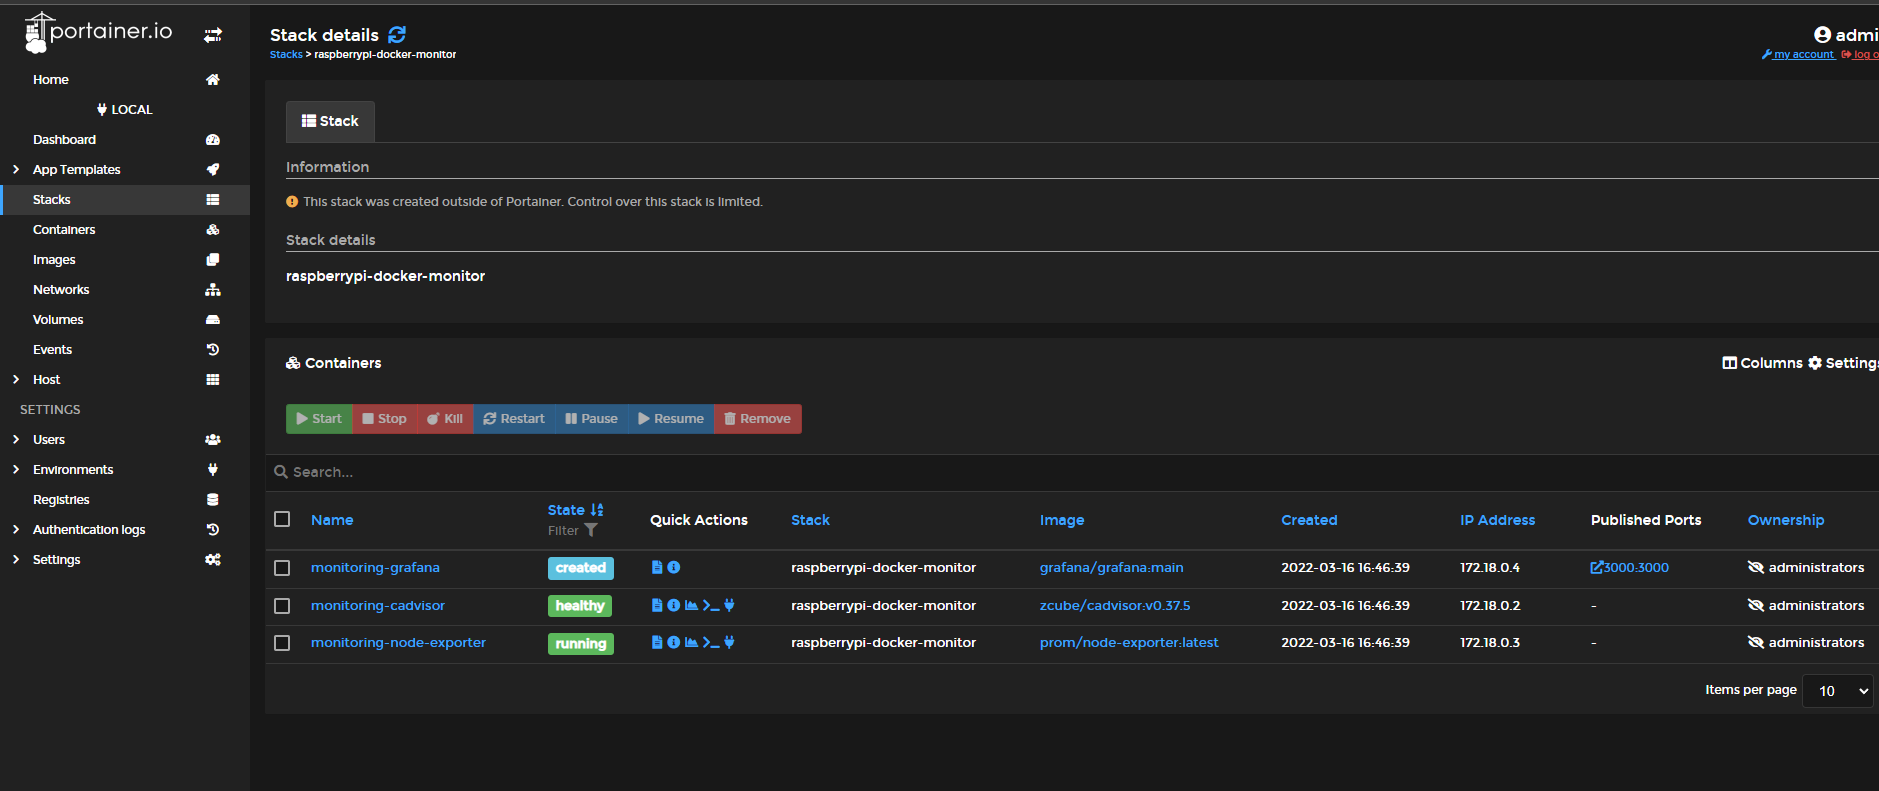
ok so now ive followed the tutorial and i have the fourth.. but the main grafana one isnt starting
Show the log of grafana, mostly because grafana.ini mounted as dir rather than file.
/portainer/Files/AppData/Config/grafana/grafana.ini , just delete and create one manually, even fill with empty space will do.
the log is empty.. it never even started even when i try to, and the stack appears to have limited control for some reason tho im logged in as admin
the log is empty.. it never even started even when i try to, and the stack appears to have limited control for some reason tho im logged in as admin
mmm strange, i follow the tutorial and for me, it all came up (tho i didn't do the cmd part right and didn't get all the information).
Have you tried removing the entire stack with the volumes and refollowing the tutorial (but maybe not as root, this might be the reason why the log is empty, as the container may not able to write to it?)
the log is empty.. it never even started even when i try to, and the stack appears to have limited control for some reason tho im logged in as admin
I noticed that the permissions for this are crucial. If you are sharing the stock via SAMBA the container does not start.