me
 me copied to clipboard
学习 C++ (Part 2: Compiling, Linking, Debugging)
概念
- Compiling (编译): 通过 compiler (编译器) 将一种语言转换另一种语言的过程
- Linking (链接): 通过 linker (链接器) 将多个文件 (object files) 合并后生成一个单一文件的过程, linking分为dynamic linking和static linking两种方式
- Debugging (调试): 通过 debugger (调试器) 跟踪程序运行的过程
之前我们写过从app.c到a.out分为4个步骤:
- Prepressing (预处理)
- Compilation (编译)
- Assembly (汇编)
- Linking (链接)
传送: C语言基础 · Issue #20 · nonocast/me
GDB
以linux来说:
- GCC: GNU Compiler Collection
- GDB: GNU Debugger
debugger是直接对可执行文件进行调试,但是有一个前提就是在编译时需要写入调试段 (debug segment)
main.c
#include <stdio.h>

int main(void) {
  printf("hello world\n");
  return 0;
}
需要在gcc中加入-g写入debug信息,通过readelf对比可以发现:
~ readelf -S app-debug | grep debug
  [28] .debug_aranges    PROGBITS         0000000000000000  0000105d
  [29] .debug_info       PROGBITS         0000000000000000  0000108d
  [30] .debug_abbrev     PROGBITS         0000000000000000  000013ae
  [31] .debug_line       PROGBITS         0000000000000000  00001490
  [32] .debug_str        PROGBITS         0000000000000000  00001561
如果没有-g,
~ gdb app-release
Reading symbols from app...(no debugging symbols found)...done.
(gdb)
只有加入-g,
~ gdb app-debug
GNU gdb (Debian 7.12-6) 7.12.0.20161007-git
Copyright (C) 2016 Free Software Foundation, Inc.
...
Reading symbols from app-debug...done.
(gdb)
debugger 一般的操作如下:
- 断点
- 单步执行
- 打印变量
- 观察变量
- 查看寄存器
- 查看堆栈
GDB help查看的command groups:
- aliases -- Aliases of other commands
- breakpoints -- Making program stop at certain points
- data -- Examining data
- files -- Specifying and examining files
- internals -- Maintenance commands
- obscure -- Obscure features
- running -- Running the program
- stack -- Examining the stack
- status -- Status inquiries
- support -- Support facilities
- tracepoints -- Tracing of program execution without stopping the program
- user-defined -- User-defined commands
比如running里面包括 (省略了很多):
- attach -- Attach to a process or file outside of GDB
- continue -- Continue program being debugged
- detach -- Detach a process or file previously attached
- detach checkpoint -- Detach from a checkpoint (experimental)
- detach inferiors -- Detach from inferior ID (or list of IDS)
- disconnect -- Disconnect from a target
- finish -- Execute until selected stack frame returns
- interrupt -- Interrupt the execution of the debugged program
- jump -- Continue program being debugged at specified line or address
- kill -- Kill execution of program being debugged
- kill inferiors -- Kill inferior ID (or list of IDs)
- next -- Step program
- nexti -- Step one instruction
- run -- Start debugged program
- signal -- Continue program with the specified signal
- start -- Run the debugged program until the beginning of the main procedure
- step -- Step program until it reaches a different source line
- stepi -- Step one instruction exactly
- until -- Execute until the program reaches a source line greater than the current
从写代码第一天接触VC6,就一直通过IDE来操作compiler和debugger,所以还是需要下沉看看水下的故事。
Debug和Release的区别就是compiler的参数区别而已,对于gcc的Debug参数可以理解为-Og (等同于-g, -O默认为level 1),这里的O指Optimize Options,0表示不优化,1-4表示优化级别,4最高。
输入run试试,
gdb app-debug --silent
Reading symbols from app-debug...done.
(gdb) run
Starting program: /home/shgbit/media-server/try/debugging-c/app-debug
hello world
[Inferior 1 (process 24444) exited normally]
(gdb) run
Starting program: /home/shgbit/media-server/try/debugging-c/app-debug
hello world
[Inferior 1 (process 24451) exited normally]
(gdb)
最常用到的command:
- list (l): 显示源程序代码的内容,包括各行代码所在的行号 (如果你给客户的是debug版本就等同于给出去了源代码)
- where (bt): 打印当前堆栈
- break line_number (b line_number): 在源代码指定的某行设置断点, 也支持break [filename]:line_number或[filename]:func_name, break也可以设置条件,如b test.c:23 if b==0
- run (r): 从头执行被调试的程序,在下一个break中暂停执行
- continue (c): 从当前位置继续运行,在下一个break中暂停执行
- next (n): 下一行
- quit (q): 退出调试
可以说这些操作和IDE中是一一对应的,IDE也是根据gdb的command来设计的,现在就有了一个初步的概念。
补充:
- 如果是一个已经运行的程序 (即没有通过gdb发起), gdb也可以通过attach进去调试
- 强烈建议跟着GDB调试入门指南 - 知乎看一遍基本就清晰了
LLDB
还是先来名词解释一下:
- LLVM: Low Level Virtual machine, 由Chris Lattner的一个虚拟机,可以理解为是一个框架,但是具体内容还是需要具体来做,可以理解为GCC,是一个Collection
- Clang/Clang++: 就是苹果开发的C/C++编译器
- LLDB: Low Level Debugger
传送: LLVM基本概念入门_P2Tree的博客-CSDN博客_llvm
官方主页也介绍的很详细:
The LLVM Project is a collection of modular and reusable compiler and toolchain technologies. Despite its name, LLVM has little to do with traditional virtual machines. The name "LLVM" itself is not an acronym; it is the full name of the project.
LLVM began as a research project at the University of Illinois, with the goal of providing a modern, SSA-based compilation strategy capable of supporting both static and dynamic compilation of arbitrary programming languages. Since then, LLVM has grown to be an umbrella project consisting of a number of subprojects, many of which are being used in production by a wide variety of commercial and open source projects as well as being widely used in academic research. Code in the LLVM project is licensed under the "Apache 2.0 License with LLVM exceptions"
Clang is an "LLVM native" C/C++/Objective-C compiler, which aims to deliver amazingly fast compiles, extremely useful error and warning messages and to provide a platform for building great source level tools. The Clang Static Analyzer and clang-tidy are tools that automatically find bugs in your code, and are great examples of the sort of tools that can be built using the Clang frontend as a library to parse C/C++ code.
The LLDB project builds on libraries provided by LLVM and Clang to provide a great native debugger. It uses the Clang ASTs and expression parser, LLVM JIT, LLVM disassembler, etc so that it provides an experience that "just works". It is also blazing fast and much more memory efficient than GDB at loading symbols.
所以,以苹果来说:
- Clang/Clang++
- LLDB
至于用法,基本和GDB一脉相承,具体内容不展开。
vscode
如果我们用shell+vim,那么对应的就是通过Makefile编译,然后LLDB直接debug,如果需要在vscode中来玩耍,则需要根据vscode的规则,当然你可以开个terminal来make, lldb,但这不属于vscode way。
vscode通过Task来实现包括linting, building, packaging, testing或是deploying这类工作,在vscode和外部通过task形成一个bridge,然后可以将其中一个task和这个project的build task关联,这样可以通过菜单(Terminal/Run Build Task)或者command-shift-B就可以直接call这个task。
对于一个新项目(rm -rf .vscode)来说, 直接command-shift-B,然后vscode会提示你创建task,选custom,
.vscode/tasks.json
{
  // See https://go.microsoft.com/fwlink/?LinkId=733558
  // for the documentation about the tasks.json format
  "version": "2.0.0",
  "tasks": [
    {
      "label": "echo",
      "type": "shell",
      "command": "echo Hello",
      "problemMatcher": [],
      "group": {
        "kind": "build",
        "isDefault": true
      }
    }
  ]
}
注:
- 这种带注释的json称为JSONC (JSON with Comments)
然后你command-shift-B就会在Terminal看到:
> Executing task: echo Hello <

Hello

Terminal will be reused by tasks, press any key to close it.
所以,你需要做的就是通过C/C++的plugin来执行这个task完成makefile中的编译过程,就是就是将Makefile翻译成json。
但是这里有一个非常取巧的地方就是,直接让task去做make
{
  // See https://go.microsoft.com/fwlink/?LinkId=733558
  // for the documentation about the tasks.json format
  "version": "2.0.0",
  "tasks": [
    {
      "label": "build",
      "type": "shell",
      "command": "make",
      "group": {
        "kind": "build",
        "isDefault": true
      }
    }
  ]
}
等同于在terminal中make,耐斯。
然后再加入一个clean,
    {
      "label": "clean",
      "type": "shell",
      "command": "make",
      "args": [
        "clean"
      ]
    }
通过command-shift-P,然后run task,选择clean运行。
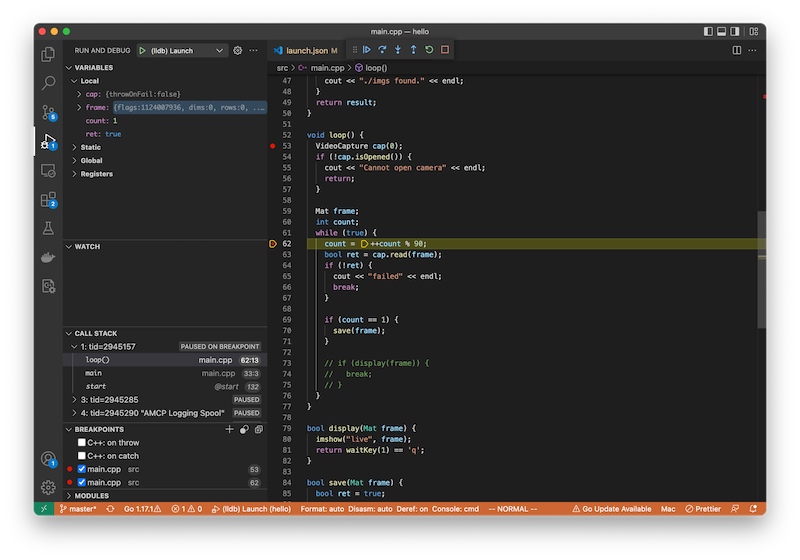
在搞定build后,在vscode的左侧中选择Run and Debug,或者直接F5 Start Debugging,选择C++(GDB/LLDB),这个会对应launch.json, 如果是x86_64直接F5就ok了,如果是arm64的arch,需要补充一个codelldb的plugin
{
  // Use IntelliSense to learn about possible attributes.
  // Hover to view descriptions of existing attributes.
  // For more information, visit: https://go.microsoft.com/fwlink/?linkid=830387
  "version": "0.2.0",
  "configurations": [
    {
      "name": "(lldb) Launch",
      "type": "lldb",
      "request": "launch",
      "program": "./build/app",
      "args": [],
      "stopAtEntry": true,
      "cwd": "./build",
      "environment": [],
      "externalConsole": false,
      "MIMode": "lldb",
      "targetArchitecture": "arm64"
    }
  ]
}
F5 OK
注:
- F5 (Start with debugging)和control-F5 (Start without debugging)本质上没有什么区别,都是Run -g的debug版本。
更新 (May 7)
- c_cpp_properties.json中配置macFrameworkPath
"macFrameworkPath": [
  "/Applications/Xcode.app/Contents/Developer/Platforms/MacOSX.platform/Developer/SDKs/MacOSX12.3.sdk/System/Library/Frameworks"
]
更新 (Jun 4)
@swiftc -target arm64-apple-macos12.3 -g -o app app.swift
如果直接lldb app会显示不支持,需要arch -arm64 lldb ./your-program
参考阅读
- GDB调试入门指南 - 知乎
- GDB调试C/C++程序
- linux常用命令--开发调试篇 | 守望的个人博客
- gdb学习 | ZYBO_o's Blogs
- How to Debug C Program using gdb in 6 Simple Steps
- GDB to LLDB command map — The LLDB Debugger
- Tasks in Visual Studio Code
- APPLE-M1使用VSCODE调试lldb无法正常使用_程序员老潘的博客-CSDN博客_lldb-mi
- VSCode配置C/C++环境 - 知乎
- 使用VSCODE生成调试Linux下C++的CMake项目_wx61b2dc8417c4b的技术博客_51CTO博客