UI Chart Won't Update after they receive empty arrays
So you have a real issue to raise...
What are the steps to reproduce?
I use the a standard ui-chart (line diagramm) to show some data. This data is only loaded after a certain time interval was selected and a load button was clicked. Until that moment I provide an empty array for each series in the chart. The whole structure looks as follows:
let dataSeries = [
    { series: ["Var1", "Var2", "Var3", "Var4", "Var5"],
      data: [[0],[0],[0],[0],[0]],
      labels: [""]
    }];
What happens?
After the dataSeries[0].data array is correctly filled with loaded values, the chart won't update. The update in the chart is only visible after pressing F5 to reload the browser. If the data is correctly loaded once updates are automatically updated in the chart without hitting F5 (which is also what I would expect).
What do you expect to happen?
Chart data should update automatically without having to hit F5.
What I found out
If I pass an completely empty array (that does not fit the requirements for the inserted data by any means) so just [] as msg.payload into the chart. The problem is gone! So valid dataformat with zero data leads to the issue!
Please tell us about your environment:
- [ ] Node-RED-Dashboard version: 2.29.3
- [ ] Node-RED version: 1.3.5
- [ ] node.js version: 12.22.1
- [ ] npm version: 6.14.12
- [ ] Platform/OS: Revpi / Stretch
- [ ] Browser: Chrome 91.0.4472.164
you aren't sending valid data - it needs both an x (usually time) and y values - see https://github.com/node-red/node-red-dashboard/blob/master/Charts.md#line-charts-1.
Thanks for the hint. I obviously missinterpreted the manual.
That changes the issue a little bit: If data is sent the way I described above, the chart doesn't update even after a set of valid data is sent to the chart. In any other case: E.g. sending no data, or valid data to the chart, after the chart receives new data, the chart is updated. Is that an intended behavior?
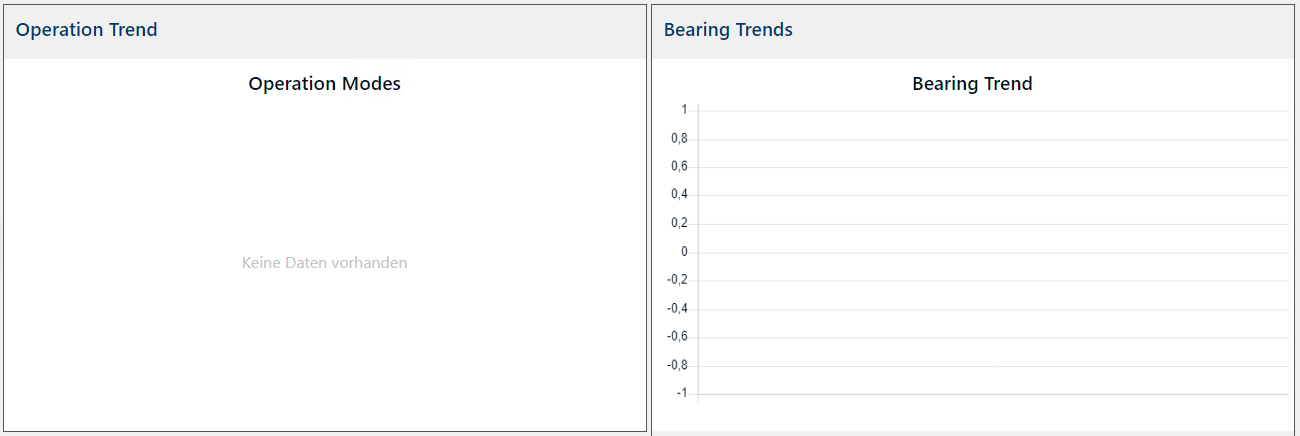
So the Chart "Operation Modes" initially received payload: "", the other one received the structure I mentioned above. Here is how this initially looks like:
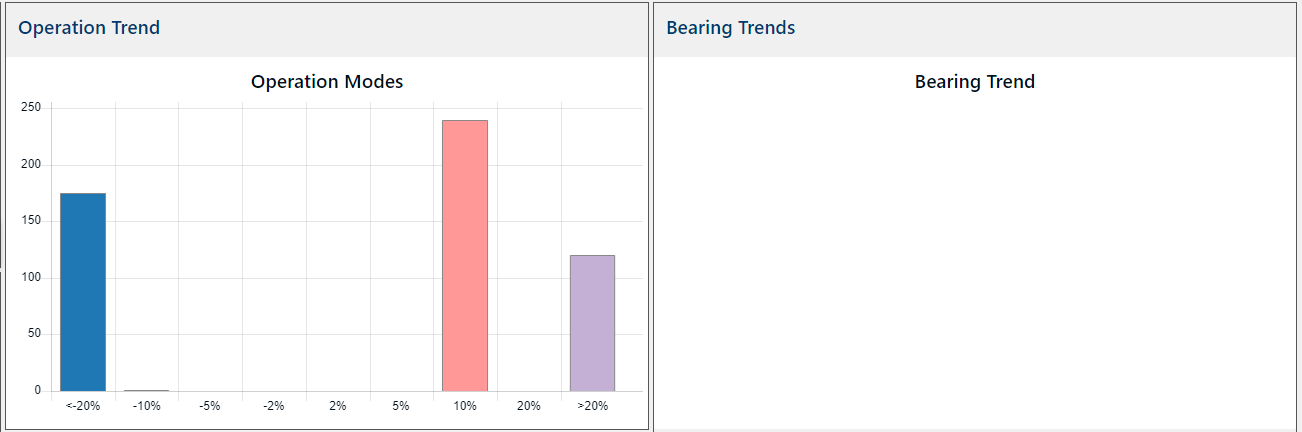
After valid data was sent to both of the charts it looks like follows:
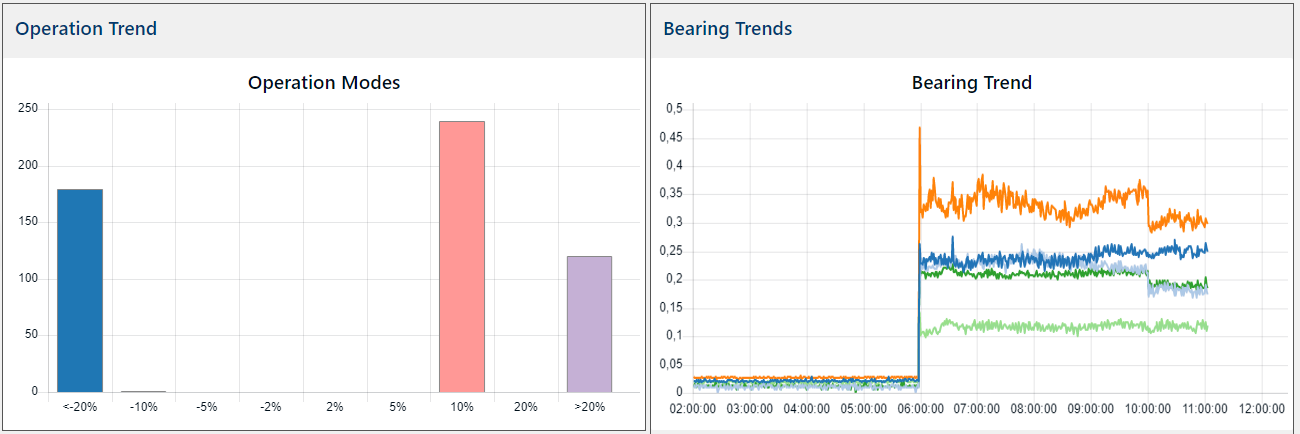
After pressing F5 the valid data is shown. But it is not directly updated, as it is with the other chart.
Not sure what you are asking... if you send valid data followed by valid data it works... and if you send invalid data then valid data it doesn't until you refresh ? That would seem to be OK to me.
I can confirm a similar problem whilst trying to preload the chart with historical data (from my SQL) , if you send an invalid data set (such that it cannot display on UI) then send a valid dataset the UI will not update unless you refresh the UI in the browser. When displaying a valid data set, you can then send different valid datasets and refreshes OK until you send a invalid set, in which case the UI display goes blank and thereafter the display does not update even if you send a valid set unless the browser display is updated.
Attached is a flow that demonstrates this (I was trying to interpret how to send a single series of data....yep missing the array in an array needed for "data" even for one series).
System is a RasPi 3B+ running Bullseye
NR 3.0.2
Node v16.17.0
NPM v8.15.0
node-red-dashboard v3.1.7 (ui_chart)
Browsers Chrome on Android and Win10
flow example.txt