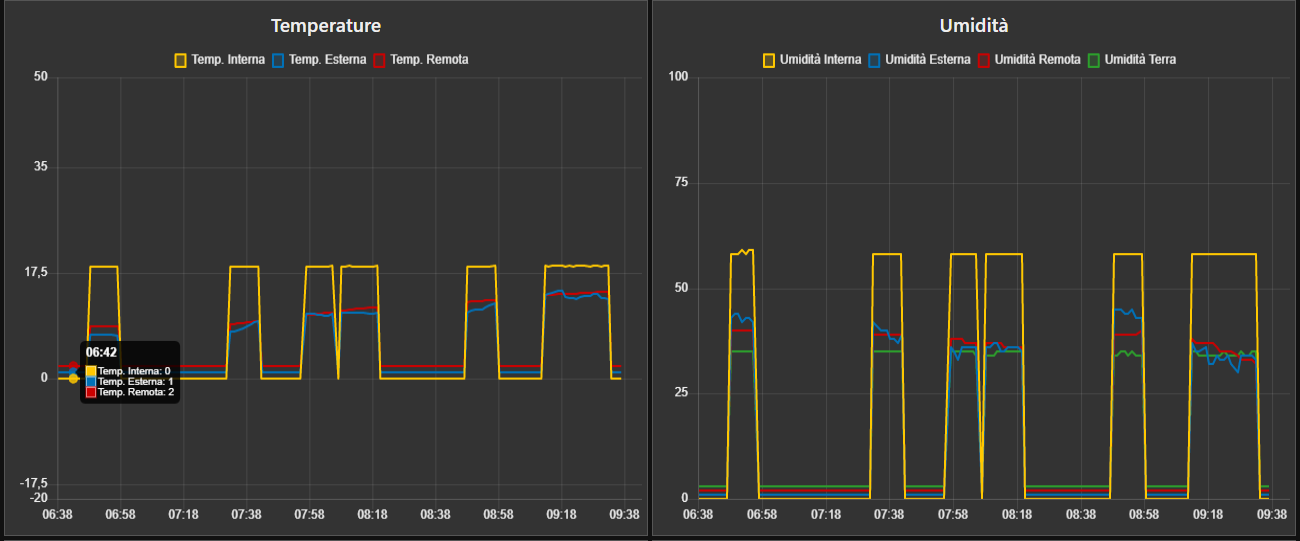
ui_chart doesn't shows new values after an indefinitive time
Hi, I'm using ui_chart instruction to plot the features of temperature and umidity of a weather station. After a indefinitive time the INPUT values aren't processed by chart node. Then, it resumes to elaborate correctly the data and after a few moments it drops down again (how you can see in the image attached). During the dropping phase, the input values are <> 0 ( i observed them with a debug node) but the chart shows them as 0, 1 or 2 (last array value) according to the order in the payload.
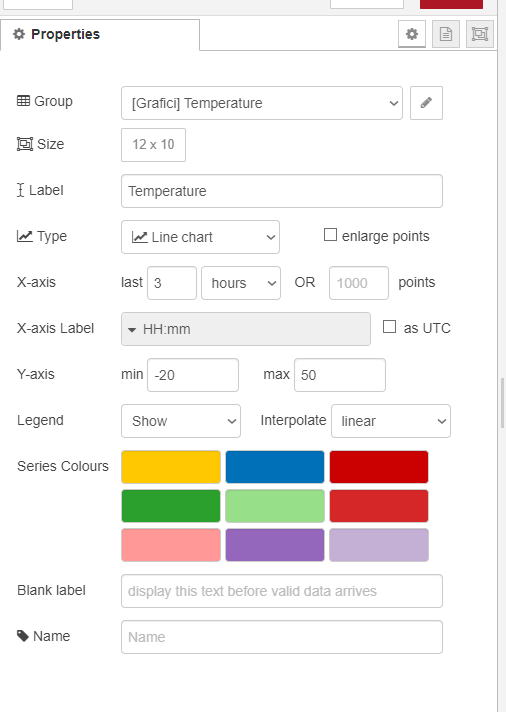
Below some other images where I show you my settings:

If I omitted any information, please ask me about.
Below my versions:
- [ ] Node-RED-Dashboard version: 2.28.2
- [ ] Node-RED version: 0.20.7
- [ ] node.js version: 8.16.0
- [ ] npm version: 6.4.1
- [ ] Platform/OS: IOT2000 Siemens image (Yocto Linux)
- [ ] Browser: Opera
This would be better being asked on the discourse forum where there are many more people who could offer help and suggestions as to what may be wrong. The chart plots the data that is passed to it - so I would suspect whatever you are doing preceding the chart is more likely to be at fault.
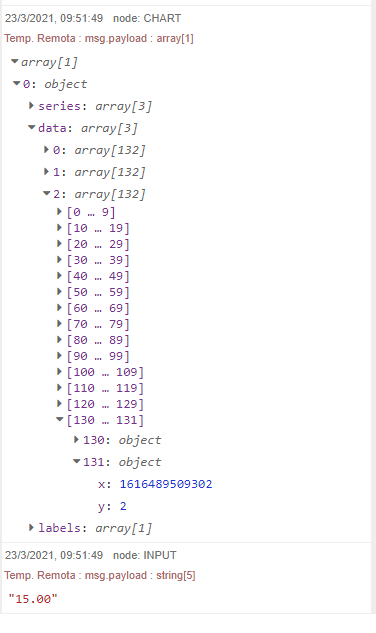
The INPUT debug block shows that the measurement (15.00) is correct, and how can you see, previous values were plotted.