PySurfer
 PySurfer copied to clipboard
Display cortical parcellation values: transparent medial wall and threshold both negative and positive values
Hi,
I used on OSX pysurfer=0.11.dev0 with python=3.6.10 and tried to display on Desikan parcellation values, containing both negative and positives values, using the following code:
coef_lh_parcel = np.array([ 0.31447462, -0.08999642,  0.20214564, -0.05422508,  0.        ,
       -0.27036938,  0.27037478, -0.11377747, -0.07266576, -0.08349062,
        0.01729273, -0.14993414,  0.04560162, -0.01732918,  0.1315399 ,
        0.01141919, -0.02154149, -0.12041933,  0.26752043,  0.05535131,
        0.08988041,  0.01791417,  0.02993955,  0.25796364, -0.14346326,
        0.05849293,  0.12087035, -0.04232418,  0.23988574, -0.01690217,
        0.13207297, -0.2849267 ,  0.07666644, -0.19848674, -0.30087969,
       -0.04686603])
aparc_file_lh = "/Applications/freesurfer/subjects/fsaverage/label/lh.aparc.annot"
max_thr_color = np.maximum(np.absolute(np.amin(coef_lh_parcel)),np.amax(coef_lh_parcel))

ALGO = "LinearSVC"
PARCEL = "Desikan"
surf = "white"
color = "Spectral_r"
filename = "montage.coef." + ALGO + "." + PARCEL
outdir = os.path.join("./",PARCEL,"Snapshots")

brain = Brain("fsaverage", hemi, surf, background="black", subjects_dir="/Applications/freesurfer/subjects/")

labels_lh, ctab_lh, names_lh = nib.freesurfer.read_annot(aparc_file_lh)
roi_data_lh = coef_lh_parcel
vtx_data_lh = roi_data_lh[labels_lh]
vtx_data_lh[labels_lh == -1] = -1

brain.add_data(vtx_data_lh, min=1.0e-10, mid=1.0e-09, max=max_thr_color, center=0, colormap=color, hemi="lh", transparent=True)
brain.save_montage(os.path.join(outdir,"lh." + filename + ".png"), order=['lateral', 'medial'], orientation='h', border_size=15, colorbar=[0], row=-1, col=-1)
And got the following result:
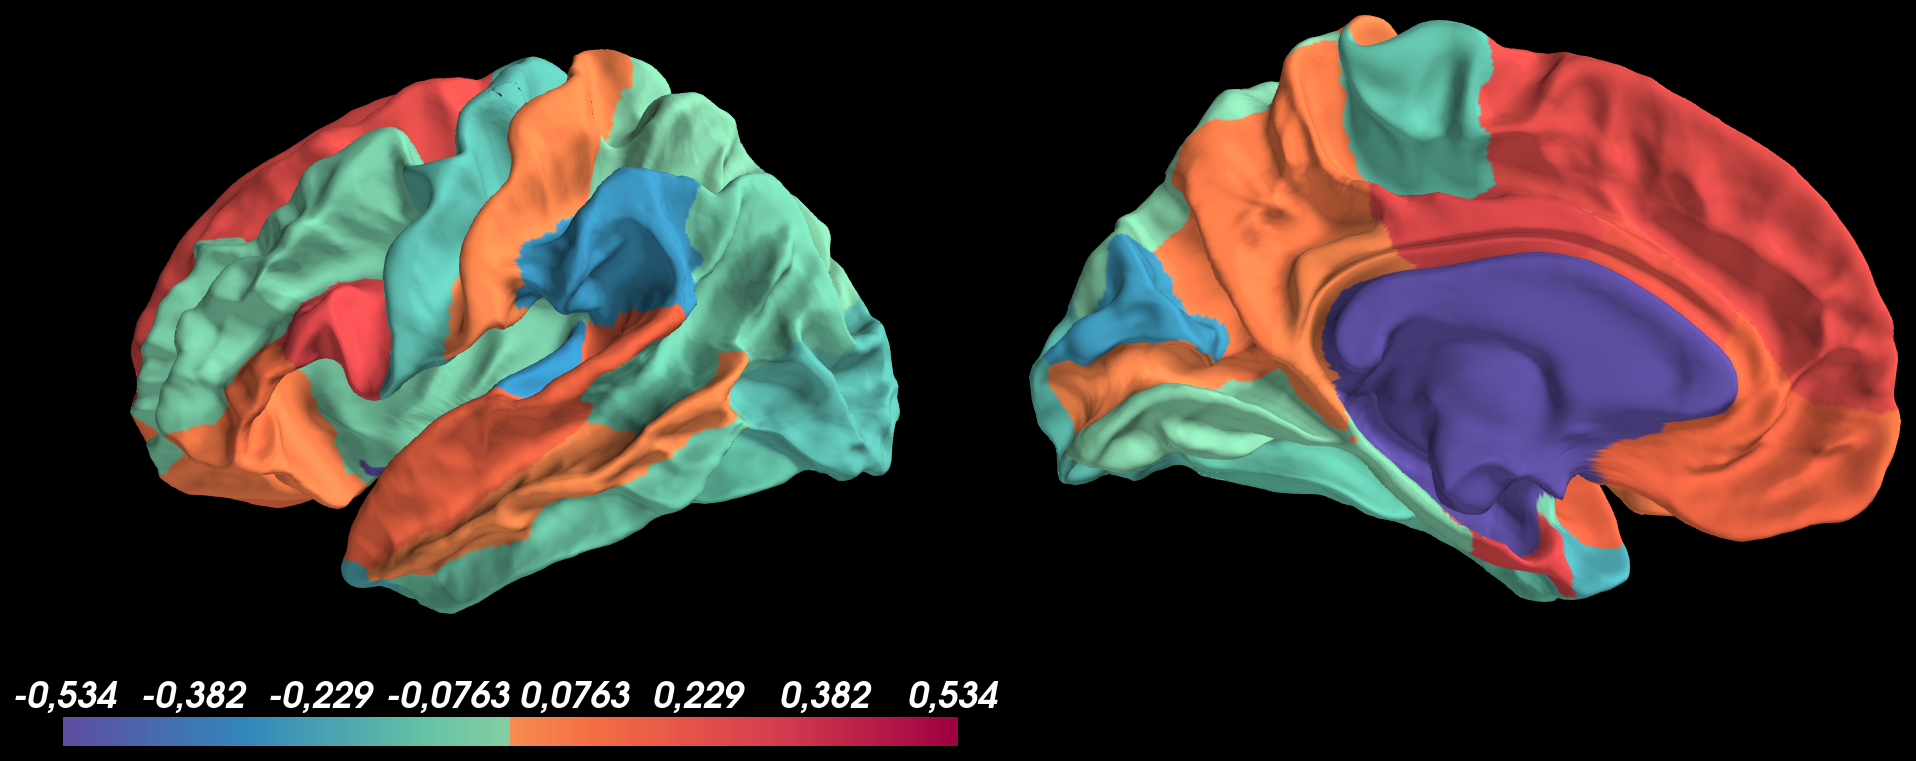
Based on this image, I don't understand why the medial wall isn't transparent?
Secondly, I tried to threshold both negative and positive values at thresh_low = 0.1 using pretty same code as before with the thresh option of add_data:
coef_lh_parcel = np.array([ 0.31447462, -0.08999642,  0.20214564, -0.05422508,  0.        ,
       -0.27036938,  0.27037478, -0.11377747, -0.07266576, -0.08349062,
        0.01729273, -0.14993414,  0.04560162, -0.01732918,  0.1315399 ,
        0.01141919, -0.02154149, -0.12041933,  0.26752043,  0.05535131,
        0.08988041,  0.01791417,  0.02993955,  0.25796364, -0.14346326,
        0.05849293,  0.12087035, -0.04232418,  0.23988574, -0.01690217,
        0.13207297, -0.2849267 ,  0.07666644, -0.19848674, -0.30087969,
       -0.04686603])
aparc_file_lh = "/Applications/freesurfer/subjects/fsaverage/label/lh.aparc.annot"
max_thr_color = np.maximum(np.absolute(np.amin(coef_lh_parcel)),np.amax(coef_lh_parcel))

ALGO = "LinearSVC"
PARCEL = "Desikan"
surf = "white"
color = "Spectral_r"
thresh_low = 0.1
filename = "montage.coef." + ALGO + "." + PARCEL + "." + str(thresh_low)
outdir = os.path.join("/Users/matthieu/Desktop/ML_visualization",PARCEL,"Snapshots")

brain = Brain("fsaverage", hemi, surf, background="black", subjects_dir="/Applications/freesurfer/subjects/")

labels_lh, ctab_lh, names_lh = nib.freesurfer.read_annot(aparc_file_lh)
roi_data_lh = coef_lh_parcel
vtx_data_lh = roi_data_lh[labels_lh]
vtx_data_lh[labels_lh == -1] = -1

brain.add_data(vtx_data_lh, min=thresh_low, max=max_thr_color, thresh = thresh_low, center=0, colormap=color, hemi="lh")
brain.save_montage(os.path.join(outdir,"lh." + filename + ".png"), order=['lateral', 'medial'], orientation='h', border_size=15, colorbar=[0], row=-1, col=-1)
And got the following result:
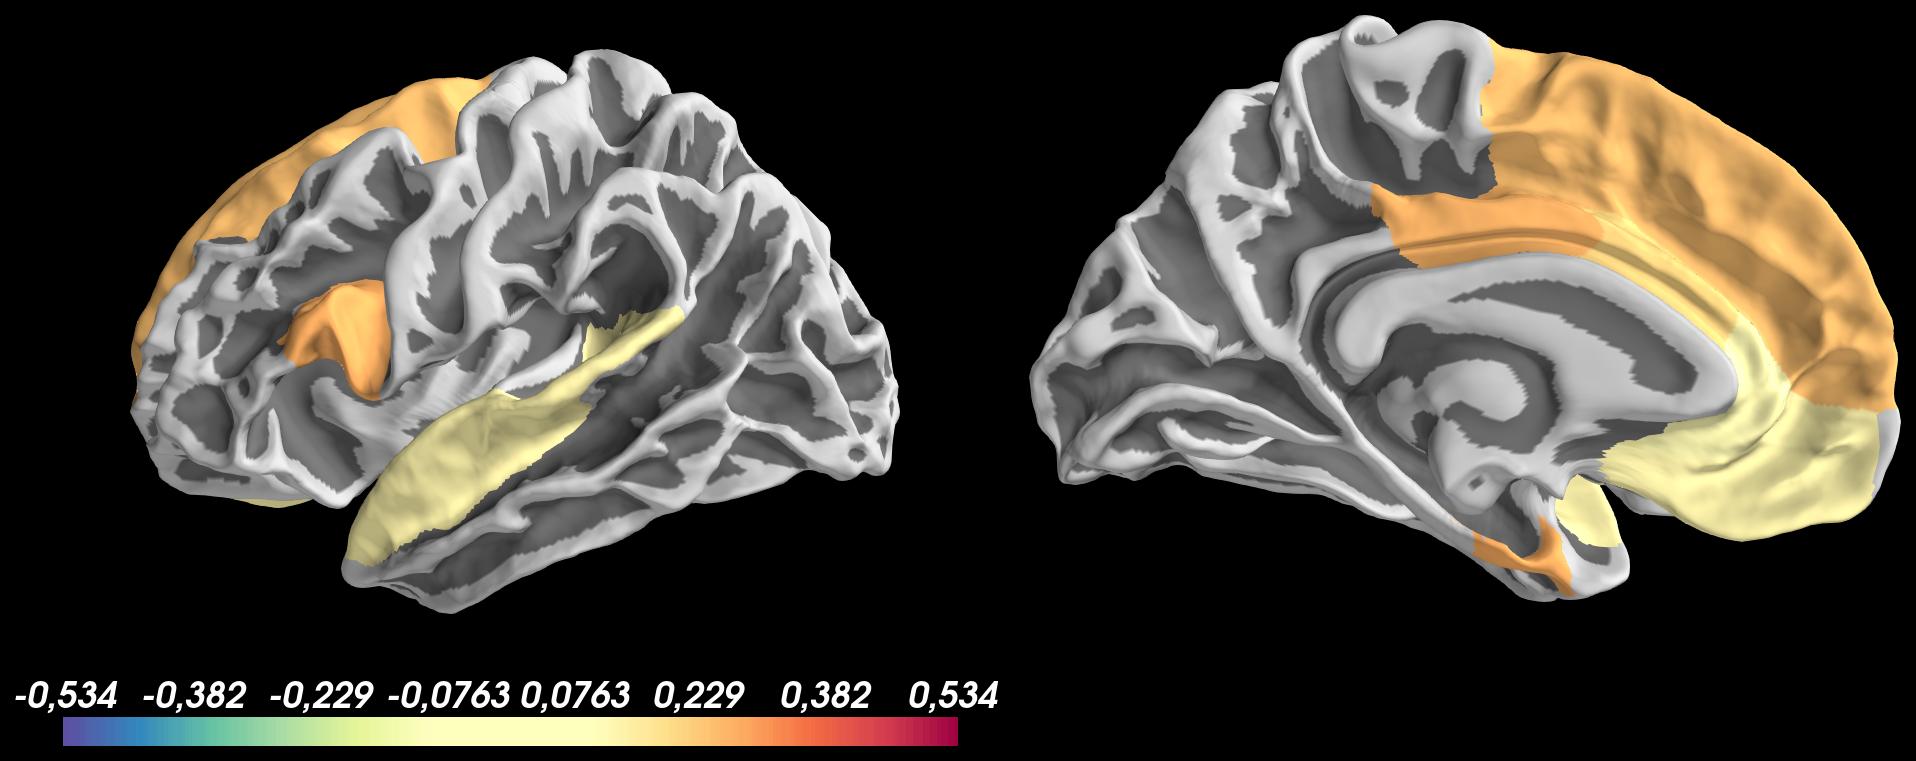
Based on this image, I don't understand why:
- positive values are thresholded at
thresh_low = 0.1but negative values are not shown - the colormap of values > 0.1 doesn't look good and colorscale bar isn't updated with values from
0.1 to 0.534for positive values and-0.1 to -0.534for negative values
Based on this image, I don't understand why the medial wall isn't transparent?
I think this is because you are setting medial wall values to -1, when I think you want 0.
Based on this image, I don't understand why: positive values are thresholded at thresh_low = 0.1 but negative values are not shown
The thresh argument doesn't interact with center the way min and max does, it just thresholds out all values lower than it. But I don't think you need it if you're using center, min, and transparent.
the colormap of values > 0.1 doesn't look good and colorscale bar isn't updated with values from 0.1 to 0.534 for positive values and -0.1 to -0.534 for negative values
I'm not sure what you mean by "doesn't look good".
Thanks for the tip about the medial wall values to 0.
I tried your advice about threshold using center, min and transparent as below:
brain.add_data(vtx_data_lh, min=1.0e-10, max=max_thr_color, transparent=True, center=0, colormap=color, hemi="lh")
and got the following image:

- But the thing is that I don't want values between
minandmidto be transparent, but just not to display the 0 values which are in medial wall. - I don't understand why the regions with the maximum values don't have the deep red or blue displayed by the colorbar
So, I tried to add a very small mid value near min to reduce the transparent regions but keeping the transparent medial wall:
brain.add_data(vtx_data_lh, min=1.0e-10, mid=1.0e-09, max=max_thr_color, transparent=True, center=0, colormap=color, hemi="lh")
But the resulting image keep displaying the medial wall even if 0<min:

My suggestion for your specific task is to use thresh and a specific value for the medial wall vertices but to make sure that you're using those properly (i.e.., set the thresh below any values that appear in your data and tag the medial wall vertices with a value below that).
But the resulting image keep displaying the medial wall even if 0<min
I think the answer here is that the colormap has 256 entries and so if the distance between center and mid is too small, no vertex will actually get painted with that value. This behavior is surprising and I think we may want to rework the code behave closer to what is expected or, failing that, warn. cc @sbitzer, you originally added this functionality; do you have bandwidth to address this issue?
Also it's annoying that there's no way to use transparent=True to threshold out values below min without getting the transparency ramp to mid, and that an exception is raised when min == mid.
I don't understand why the regions with the maximum values don't have the deep red or blue displayed by the colorbar
I can't replicate this behavior on my system; the colormap maxes out at the maximum value in the data for all permutations of your examples.
Also it's annoying that there's no way to use transparent=True to threshold out values below min without getting the transparency ramp to mid, and that an exception is raised when min == mid.
We could add a transparent='min' meaning "anything at or below min is transparent to deal with this use case (which I've also hit).
I think the answer here is that the colormap has 256 entries and so if the distance between center and mid is too small, no vertex will actually get painted with that value. This behavior is surprising and I think we may want to rework the code behave closer to what is expected or, failing that, warn.
Agreed we should try to rework the code if possible
Ok I will use thresh at the lowest negative values above the value of medial wall.
However, there is still a problem if I want to threshold the values symmetrically (both negative and positive values) to a particular min value.
However, there is still a problem if I want to threshold the values symmetrically (both negative and positive values) to a particular min value.
Not really; you can generalize the approach pretty easily:
vtx_data[np.abs(vtx_data) < thresh_val] = sentry_val
Where thresh_val is the data-space threshold, sentry_val is an arbitrarily small (negative) number, and you set the display threshold between sentry_val and the actual data min.