Adding a vmin option to plot_stat_map plot_glass_brain functions
Hi, I see that there have been a couple of related issues in the past requesting a "vmin" parameter for the plot_stat_map and/or plot_glass_brain functions (e.g. this and this), and was wondering if this has been implemented/is being worked on.
Benefits to the change
While the current implementation (only one half of the spectrum for positive/negative values alone) is a great way to ensure that positive/negative activations maintain their separate colors, it will be very helpful to get the whole color spectrum (within a desired vmin/vmax) to present other data (e.g. timepoints at which certain events occur) . This is especially important if the data is skewed (i.e., several nodes have very low/high values). Example below:

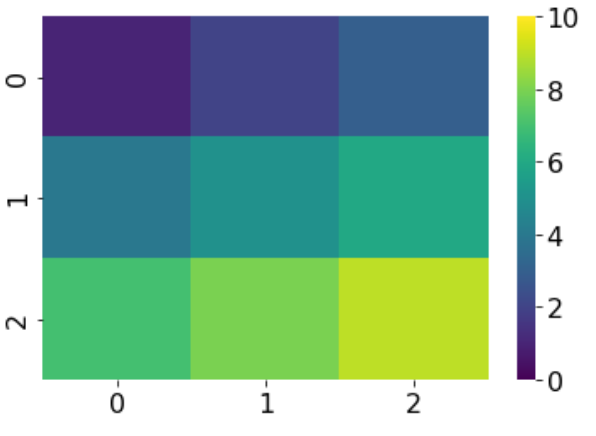
I'd like to get the whole range of the colormap 'viridis' on the brainmap - i.e., from dark blue to yellow, such as is possible with seaborn heatmaps (example below):
The suggested solutions that I found so far - setting symmetric_cbar to False or using the plot_img function instead of the ones mentioned above won't suffice unfortunately.
Thanks in advance!
Thx for bringing this back.
Note that in plot_stat_map, it is hard to see the lowest values, in a non-sparse setting, because the region with low values are masked visually by regions with high values.
This being said, I don't remember well why we haven't kept the vmin argument. Maybe @jeromedockes remebers ?
Best,
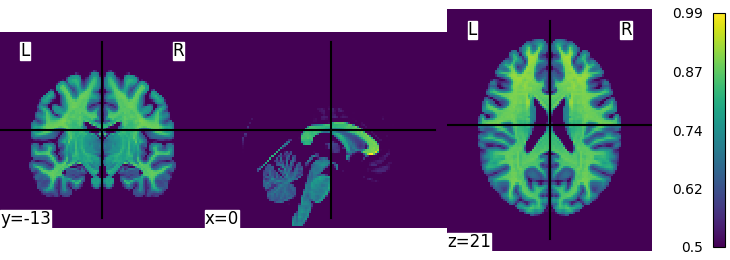
As mentioned by @bthirion in both linked issues, for the case of plot_stat_map, using plot_img instead does suffice.
from nilearn import plotting, datasets
plotting.plot_img(datasets.load_mni152_template(), colorbar=True, vmin=.5)
For the case of plot_glass_brain, I agree there is a bug: there is a vmin parameter but it is ignored and its documentation is incorrect. We can start to implement its description and possibly add a symmetric_cmap parameter as in the view_img function
Note that in plot_stat_map, it is hard to see the lowest values, in a non-sparse setting, because the region with low values are masked visually by regions with high values.
do you mean plot_glass_brain ?
Thank you for the replies! plot_img unfortunately doesn't seem to work when there are negative values in the range - for example, the data ranges from -.32 to 3, so the symmetric_cmap parameter switches back to True, as a result of which the vmin parameter is also ignored (see screenshot below).
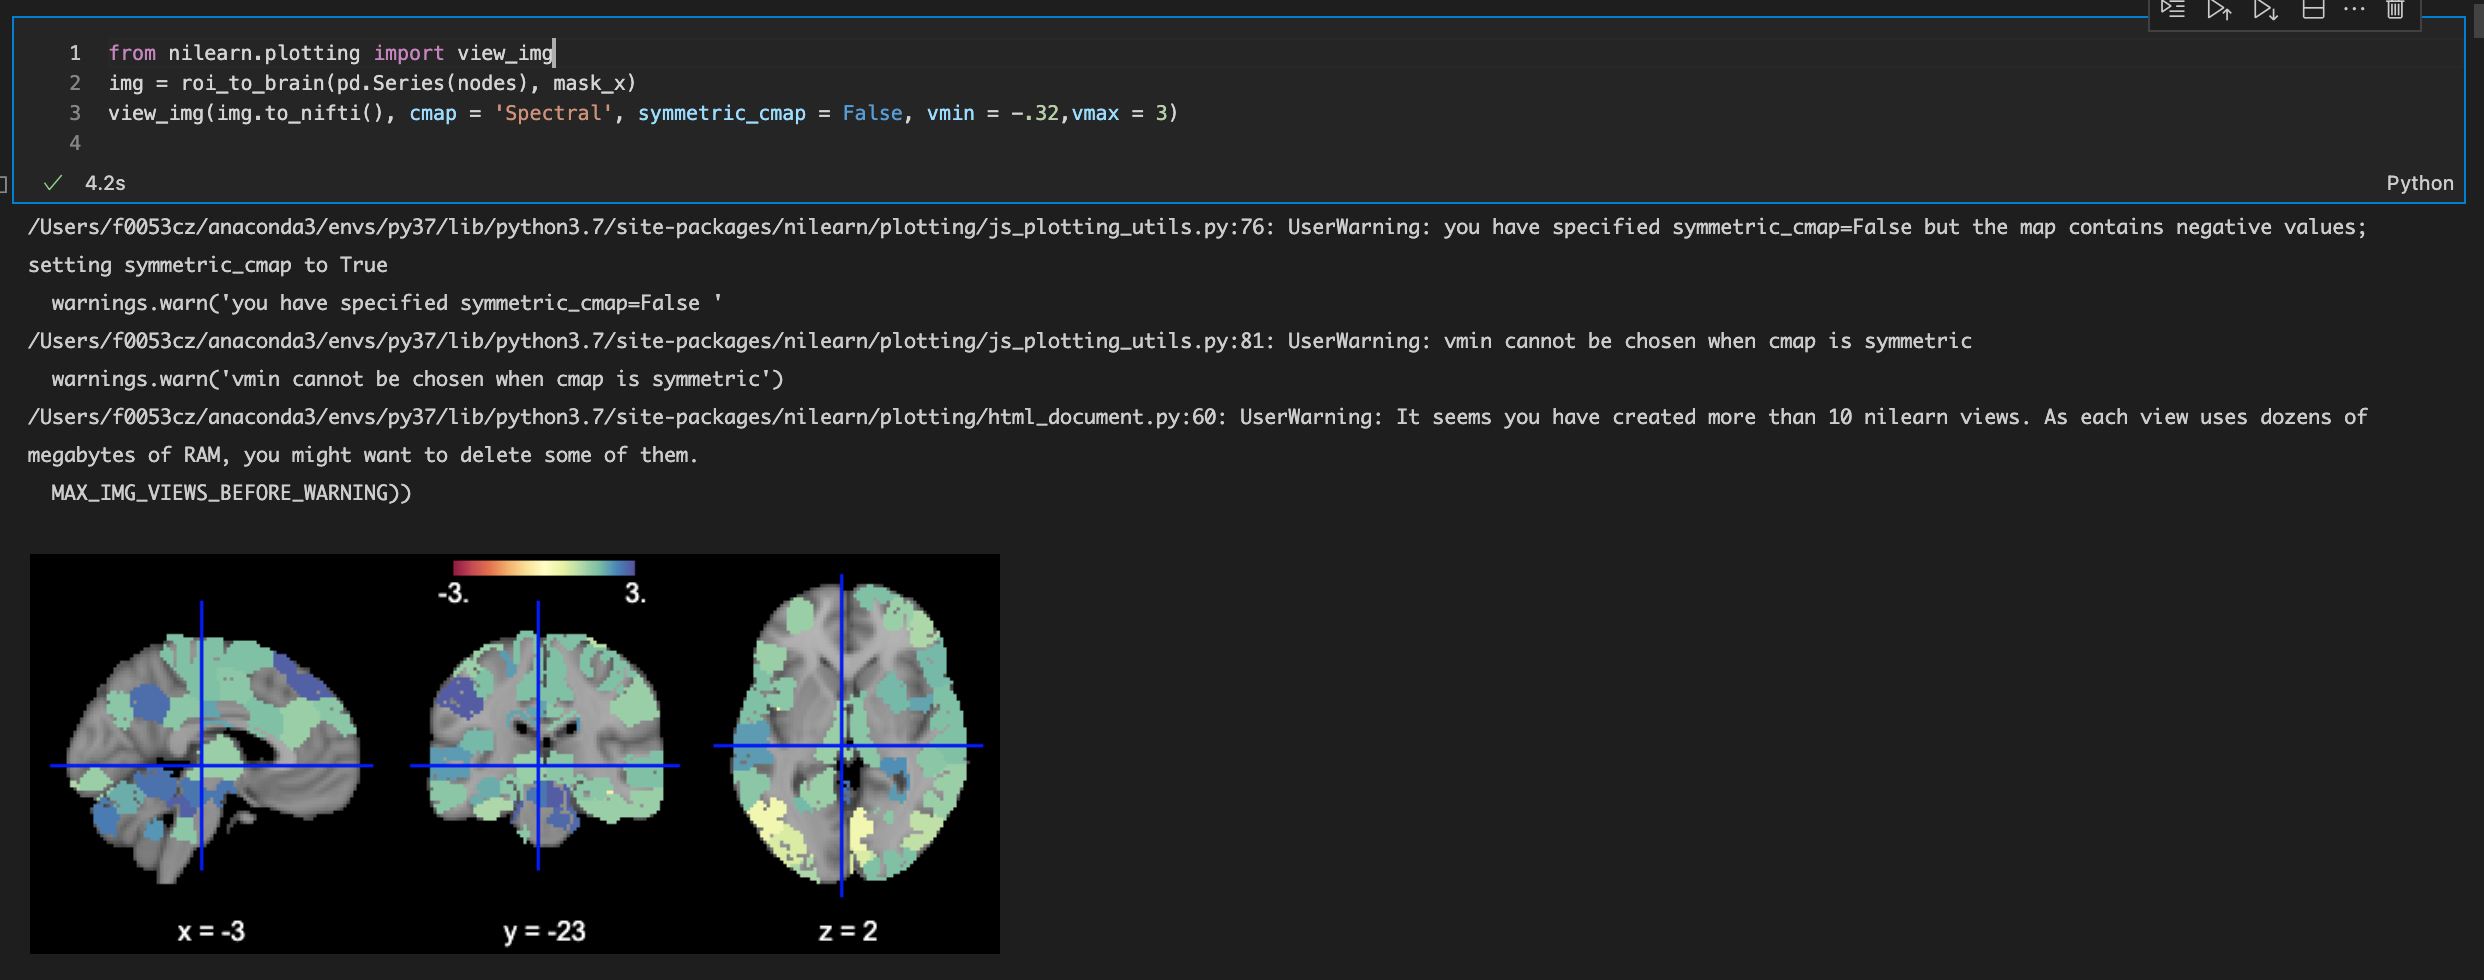
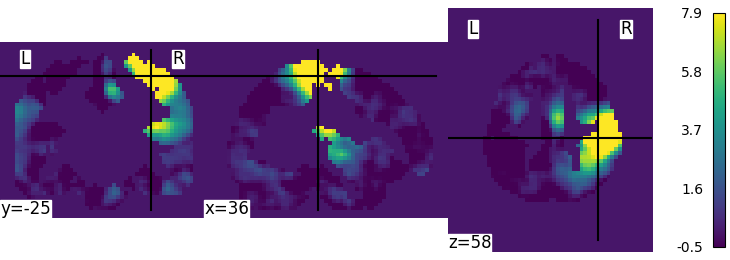
The screenshot uses view_img. plot_img always allows setting any vmin:
from nilearn import plotting, datasets
img = datasets.fetch_neurovault_motor_task()["images"][0]
plotting.plot_img(img, colorbar=True, vmin=-.5)
we could remove the check that forces the cmap to be symmetric in view_img when there are negative values, as symmetric_cmap=True is the default
Thanks for your answering.
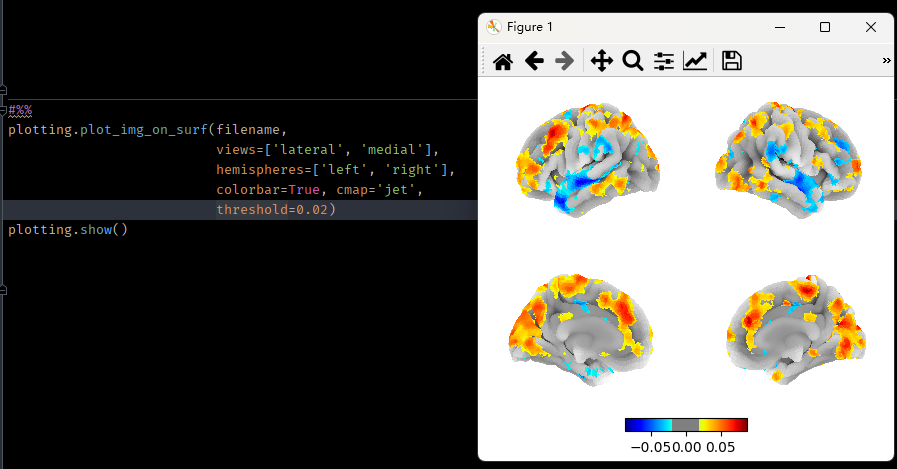
I notice that the function "plotting.plot_img_on_surf" still does not support a "vmin" argument (nilearn version 0.9.1). If I enter a vmin parameter, it will raise an error saying "ValueError: this function does not accept a "vmin" argument, as it uses a symmetrical range defined via the vmax argument. To threshold the plotted map, use the "threshold" argument".
But unfortunately, the "threshold" argument still brings out a symetrical colormap. The colorbar always contains symetrical positive and negative sides. How could I set the vmin of colorbar when plotting images on surface, e.g. showing only the positive values?
 ?
?
I think that this comes from historical reasons, but I indeed think that plot_img_on_surf shoudl accept a vmin argument.
bthirion @.***> writes:
I think that this comes from historical reasons, but I indeed think that
plot_img_on_surfshoudl accept a vmin argument.
I agree. ATM it relies on plot_surf_stat_map, it would have to use
plot_surf instead. A symmetric_cmap argument, true by default (as in
view_surf and plot_surf) would also proably have to be added.