very slow?
Is there any way of speeding up the process of the preview generation? I have added 40k files to my gallery and used files::scan --all to add them to the database which finished in a reasonable time.
Now I am trying to pre-generate all the previews but it's taking ages. It's been running for 15h and only managed about 3k files. This is crazy. Looking to htop/top and my machine is basically idle while the preview generation chugs along (I'm running an ubuntu vwmare image on my surface pro2). Are there any "tricks" in speeding things up? eg. running multiple threads, forcing it to use more CPU?
Nextcloud 13.0.0.14 with a mysql database.
In a similar situation detailed at this issue on the NextCloudPi repository I have the preview generation running for two weeks and it's still going. I am not sure if the problem is in the app or the CPU's abilities. (And between armv7, x86 and generations of each we have room for a lot of variance). I 'm just grunting through in my case. But if there are ways to speed it up or give feedback I am all ears.
I have a similar problem. I am currently running this on a machine with 4 cores/8 threads, but according to htop, only 1 thread gets a load of 15-40%. In other words, not even a single core gets a full load. Is there some kind of CPU throttling for php going on? It looks like in my scenario it will take weeks for preview generation to finish (preview:generate-all). Any way to speed this up or use more than one core/thread?
By the way, I just noticed that libreoffice is invoked for generating thumbnails for certain file types (I have seen this used for *.docx — MS Word — files). The corresponding process (soffice.bin) does go to 100% load of one thread. So is the limited CPU load described in my previous comment something php-specific?
I am generating previews right now, and I get one CPU at 80-100%, only one though.
Your bottleneck must be somewhere else ;)
Hm. Interesting. Any idea what it could be? All HDs are local, so I doubt read/write bandwidth is an issue. I found out that on average my machine creates about 2-3 previews per second. Suppose if the original image is 5 MB and the algorithm is not smart, this would be about 15 MB/sec. Not dramatic, but actually more than I expected. If the algorithm is smart, it would load the image only once for all 20 previews generated for each image. There is also plenty of free RAM on the machine, and swap is practically at zero.
I would check the wa value in the output of the top command, to see if your system is blocked waiting for I/O.
Wow. Interesting. Thanks!
In my case, it says %Cpu(s): 1.7 us, 0.5 sy, 0.0 ni, 91.7 id, 6.0 wa, 0.0 hi, 0.1 si, 0.0 st. I guess that means that I am limited by i/o correct? (This is with preview generation running.)
The data directory is on an external HD connected via USB3. So both the original pictures and the previews being created are on the same drive. Would it perhaps help to (temporarily) move the preview folder to another physical drive (and symlink to it)? That way, the read and write load would be on different drives. I may be able to afford a smaller SSD for something like the preview folder, but putting all of my data on SSD is cost prohibitive at this point.
Well, I am running on a very very old spinning USB drive and I have everything there.
Maybe try sudo iotop to see if there is something else in your system accessing the harddrive at the same time
edit: as a comparison, I get ~80% CPU and ~1.5 wa
I am still trying to figure this out. I ran this: sudo iotop -ao -b -n10.
(The should accumulate/average output over 10 seconds.)
The output from the 10th run looks like this:
Total DISK READ :     508.80 K/s | Total DISK WRITE :     638.96 K/s
Actual DISK READ:     508.80 K/s | Actual DISK WRITE:     820.39 K/s
  TID  PRIO  USER     DISK READ  DISK WRITE  SWAPIN      IO    COMMAND
  413 be/3 root          0.00 B     60.00 K  0.00 % 48.94 % [jbd2/sda6-8]
 2330 be/4 mysql       272.00 K    632.00 K  0.00 % 39.58 % mysqld --daemonize --pid-file=/run/mysqld/mysqld.pid
 1735 be/4 mysql         0.00 B      0.00 B  0.00 %  7.15 % mysqld --daemonize --pid-file=/run/mysqld/mysqld.pid
 1737 be/4 mysql         0.00 B    576.00 K  0.00 %  6.20 % mysqld --daemonize --pid-file=/run/mysqld/mysqld.pid
  478 be/3 root        372.00 K    108.00 K  0.00 %  4.60 % systemd-journald
 1793 be/4 mysql       108.00 K     16.00 K  0.00 %  3.75 % mysqld --daemonize --pid-file=/run/mysqld/mysqld.pid
 1734 be/4 mysql         0.00 B      0.00 B  0.00 %  3.29 % mysqld --daemonize --pid-file=/run/mysqld/mysqld.pid
  789 be/3 root          0.00 B     64.00 K  0.00 %  1.14 % [jbd2/sdc1-8]
 2845 be/2 www-data   1036.00 K   1124.00 K  0.00 %  1.12 % php /opt/nextcloud/occ preview:generate-all
 1796 be/4 mysql        16.00 K      0.00 B  0.00 %  0.96 % mysqld --daemonize --pid-file=/run/mysqld/mysqld.pid
 1733 be/4 mysql         0.00 B      0.00 B  0.00 %  0.82 % mysqld --daemonize --pid-file=/run/mysqld/mysqld.pid
 1736 be/4 mysql         0.00 B      0.00 B  0.00 %  0.66 % mysqld --daemonize --pid-file=/run/mysqld/mysqld.pid
14855 be/4 hasi         20.00 K     16.00 K  0.00 %  0.29 % tee a4
31370 be/4 root          0.00 B      0.00 B  0.00 %  0.04 % [kworker/u16:2]
10710 be/4 root          0.00 B      0.00 B  0.00 %  0.02 % [kworker/u16:0]
 1807 be/4 root          0.00 B     12.00 K  0.00 %  0.00 % python3 /usr/bin/fail2ban-server -xf start
11356 be/4 www-data      0.00 B     12.00 K  0.00 %  0.00 % apache2 -k start
That's pretty puzzling. The read/write rates are a fraction of what a USB3 external drive should be able to do. So what's causing the wait? CPUs are still mostly idling, and I don't know why.
OK, I did a little bit more thinking... I appears that [jbd2/sda6-8] is actually not the external drive with the data; it's the internal drive. It's a brand new 500GB drive that came with a new Dell server. It's on this drive where the database files should be sitting. So is the repeated mysql db access what's limiting my performance?
I also ran an iostat -x 10 and got this:
avg-cpu:  %user   %nice %system %iowait  %steal   %idle
           1.38    0.00    0.33    5.72    0.00   92.58

Device            r/s     w/s     rkB/s     wkB/s   rrqm/s   wrqm/s  %rrqm  %wrqm r_await w_await aqu-sz rareq-sz wareq-sz  svctm  %util
sda              0.50   60.40      4.80    481.60     0.00    23.90   0.00  28.35    9.60   17.15   1.04     9.60     7.97  15.21  92.64
sdb              0.00    0.00      0.00      0.00     0.00     0.00   0.00   0.00    0.00    0.00   0.00     0.00     0.00   0.00   0.00
sdc              0.50    2.60     24.00     81.20     0.00     3.40   0.00  56.67    6.40    2.92   0.01    48.00    31.23   2.32   0.72
The db is on sda, my data is on sdc.
The actual i/o throughput (volume) on sda is not so high. Even the other numbers do not look like they are really high. So why is the %util so high? Is there any way to tune it? Or is an SSD the answer?
I would like to report back that even after a serious number of attempts, I have not been able to improve the speed situation. Here is what I found.
- System is a 4-core/8-thead CPU (Xeon), 8 GB or RAM
- Nextcloud 13.0.0.0 using PHP7.1 on ubuntu server 18.04
- I am using redis for memcache locking, using APCu for memcache
- I did a fair bit of MYSQL tuning (
mysqltuneris not complaining any more). I increased buffers, log file sizes, etc.
Still, while running preview:generate-all I am still maxing out my HD to the extent that >90% of the HD load are between jbd2 and mysqld. My CPUs are >90% idle. Any idea what's causing so much I/O during thumbnail generation? Shouldn't the generation of thumbnails generate enough load on the CPU so that simple db access is NOT the bottle neck? What's really written to the db? Wouldn't it simply be the information what thumbnails are present for which file?
@nachoparker : thank you so much for your very helpful contributions! That was a great idea! I found this page quite helpful: https://serverfault.com/questions/363355/io-wait-causing-so-much-slowdown-ext4-jdb2-at-99-io-during-mysql-commit. I found the answer from JinnKo particularly helpful:
I implemented steps 1 & 2: sync_binlog = 0 and innodb_flush_log_at_trx_commit = 2. From many things I tried to optimized db performance, those were the first ones that brought a significant improvement. Those move a little bit away from the highest levels of reliability; however, in my case, this is a very acceptable tradeoff. (Database may be un-synched on disk for 1 second or so.)
Disk load of the db disk went down from >90% to 30%-50%. I still feel that this is not coded efficiently. Writing the db updates to the new thumbnails/previews should not take longer than creating the thumbnails. Also, when preview:generate-all is run on a folder with already existing previews (no new ones created), there is still a lot of 'write' activity on the db.
great, thanks for sharing!
I still feel that this is not coded efficiently.
I completely aggree
@nachoparker : without your help, I still would not have solved the problem. Thank you so much!
Any more suggestions on speeding things up? Even with an SQL server on an SSD + IO caching (KVM) things are just slow. Currently indexing 30k+ images and while occ is running (per NC user) one thread at 70-90% CPU (E5 1650v2 @4.2 GHz) things take ages. Neither on my Nextcloud machine nor on the SQL server there is any bottleneck in IO, iowait is <<2%.
Could it be that the thing slowing stuff down is that each and every thumbnail that has been created is immediately written to SQL, (open connection, do transaction, close connection ... repeat!). Having all this SQL overhead surely slows things down :thinking:
Any speedup? On Arch + ZFS with Celeron G1610T @ 2.30GHz:
- one thread at 90%,
- iowait <5%,
- disk R/W ~5M/s.
An approximately generation speed: 4k preview dirs per 24 hours.
I facing similar issues. Preview generation goes slower and slower until it takes several minutes per file. Can't see anything specific in the log, even with debugging enabled.
CPU and I/O load is nothing according to top and iotop. In this screenshot it's been running for most of the day. (highlighted row)
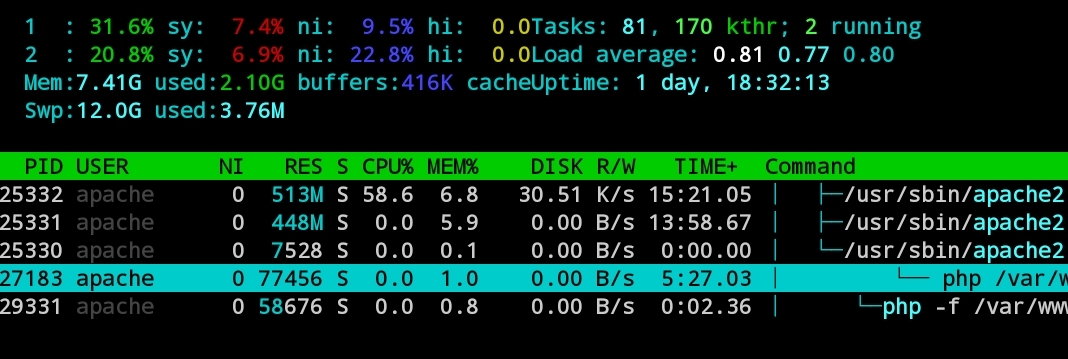
Nextcloud 13.0.5 PHP 7.1 Apache 2.4.34
Did some strace on the php process when running preview:generate-all
it seems as most of the time it is stuck in POLL,waiting for oc_filecache to be committed to disk.
sendto(3, "\330\0\0\0\3UPDATE oc_filecache SET `"..., 220, MSG_DONTWAIT
NULL, 0) = 220 <0.000809>
poll([{fd=3, events=POLLIN|POLLERR|POLLHUP}], 1, 1471228928) = 1 ([{fd=3, revents=POLLIN}])
So I had to reduce mariadb binlog_commit_wait_usec to speed it up. However this is not very good for my disk I/O.
Why is there a need to poll? Can this be removed?
I've identified a (small) overhead, that I tried to fix in https://github.com/nextcloud/server/pull/34910 It should be safe to apply if you use local storage. Otherwise… use at your own risk.
The main advantage of this is for images that already have all their preview images existing. But of course, this has also an impact on images that don't, since listing directory for each preview size isn't cheap.
I guess the next step is to send one DB call for all previews at once…
The PR at https://github.com/nextcloud/previewgenerator/pull/320 might help with that. Previously, 4 obsolete arrays were allocated for each file.