Active Storage 7 raises incomplete transaction warnings in the newrelic_agent.log file
When uploading an image using Action Text, Active Storage 7 raises incomplete transaction warnings in the newrelic_agent.logs like:
WARN : Segment: Nested/Controller/active_storage/blobs/redirect/show was unfinished at the end of transaction. Timing information for this segment'sparent Middleware/Rack/ActionDispatch::Routing::RouteSet/call in Controller/active_storage/blobs/redirect/show may be inaccurate.
The same warning is not raised when uploading an image using Active Storage 6.
Debugging strategy proposal:
- Point bundler to a relative local path for Active Storage and use git bisect to step through the commits between Rails 6 and Rails 7 and determine when the change was introduced that raises the warning
We have yet to discover the root cause of this issue. We have been able to determine the scope is within only nested controller calls to ActiveStorage 7 paths. ActiveStorage 7 instrumentation and measurement is not effected.
This warning was raised while using the local disk as the storage service. We are not aware if this warning is likely to pop up when other storage solutions are used (ex: S3, AzureStorage, GCS).
This warning indicates the timing for the displayed segment was unfinished when its parent transaction was finished. This may lead to inaccurate durations for the named segments. Use duration data for segments that have this warning with the awareness that they could be longer or shorter than the displayed time.
We'll pick this issue back up when we begin work on instrumenting new Rails 7.0 features.
This is not ready for t-shirt size, as the root cause for the warning has yet to be established.
This is likely caused by timing/concurrency, so the multi-threading work on the agent may resolve this issue for us.
Value to the customer would be providing accurate timing information for (possibly) multi-threaded transactions that are built into normal Rails processes.
@kaylareopelle I'm seeing this on production (Rails 7.0.3, Ruby 2.7.6) with an AWS S3 storage backend, what information would be most useful to share?
Here's a sample from our NewRelic dashboard for the ActiveStorage proxy controller (bucket names redacted).
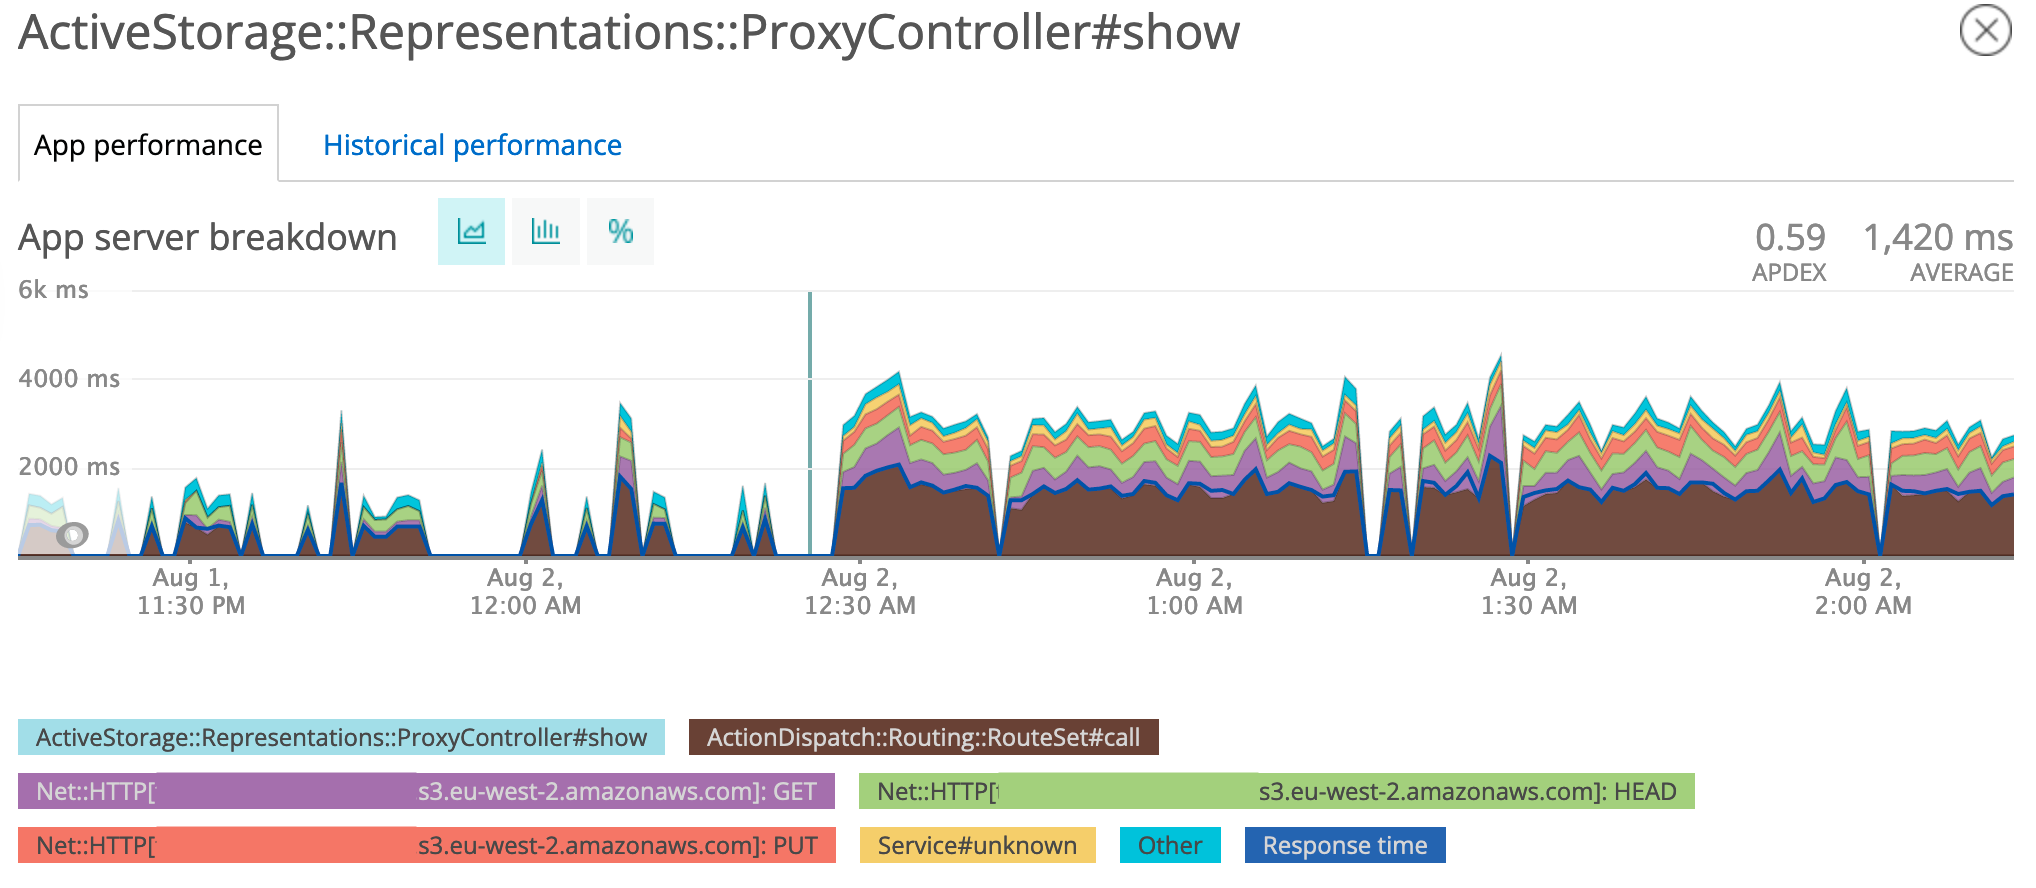
As you can see, the response time (blue) is drastically lower than the total - presumably that's a symptom of this issue?
Hello @developius! Thanks for reaching out!
I think the response time is a symptom of this issue. Do you have access to the application's newrelic_agent.log file? It would be nice to know if you're getting warnings like the one in the initial issue description:
WARN : Segment: Nested/Controller/active_storage/blobs/redirect/show was unfinished at the end of transaction. Timing information for this segment's parent <parent segment> may be inaccurate.
I believe WARN-level logs should be printed by default.
Also, which version of the agent are you using?
@kaylareopelle sharing the warning I was getting would've been sensible 😆
We're using newrelic_rpm v8.7.0 (I see we're due for an update).
Here's what we're seeing:
WARN : Segment: Nested/Controller/active_storage/representations/proxy/show was unfinished at the end of transaction. Timing information for this segment'sparent Middleware/Rack/ActionDispatch::Routing::RouteSet/call in Controller/active_storage/representations/proxy/show may be inaccurate.
Interestingly, we didn't see this warning when using the redirection mode of ActiveStorage. When we switched to proxy mode, these started showing up.
Thank you, @developius! This is really helpful information. I think the next best step would be to escalate this issue to our Global Technical Support team. This will also give us a secure space to share more sensitive information like your Gemfile, code snippets and debug-level logs. It will also help our team more quickly address the fix.
To submit a ticket to support, we have two strategies depending on your New Relic account level:
- If you have a paid account that allows you to submit support tickets, please open one on our Support Portal with a link to this GitHub issue
- If you're on the free tier or a paid level without support, please post a question on the New Relic Explorer's Hub with a link to this GitHub issue
Please let me know when you're finished submitting your ticket and/or if you need any help!
@kaylareopelle I've opened a new topic on the Explorer's Hub here: https://discuss.newrelic.com/t/activestorage-controllers-in-rails-have-misrepresented-timing-in-new-relic/188839
Thank you! Our team is off through August 12. I'll get back in touch on Monday!
Hi @developius,
My apologies for the delay in getting a response back to you. I really wanted to be able to come back to you with very good news about a definitive "fix" for any unwanted behavior you're seeing, but unfortunately all that I am able to offer at the moment is more of an explanation for you and others.
There are a few items that this GitHub Issue touches on, and I'll address what our team knows so far about each. You may not be experiencing all of these.
ActionDispatch::Routing::RouteSet#call
Users sometimes wonder about ActionDispatch::Routing::RouteSet#call appearing in their New Relic web UI views, and how much time is reported for it. Essentially everything that the New Relic observed Ruby on Rails web application is doing in response to a web client accessing a given route falls under this RouteSet#call section. Even though the MVC (model, view, and controller) portion of handling a route call might be very quick to finish, there can be other asynchronously running operations and middleware involved that contribute to time being spent in RouteSet#call. One of our customers provided us with an excellent writeup of this issue. If the time spent in RouteSet#call is considered to be problematic, that writeup offers the suggestion of using New Relic Ruby agent custom instrumentation to provide more granular timing for individual middleware calls.
WARN : <TRANSACTION NAME> was unfinished at the end of transaction
The New Relic Ruby agent log file (located at log/newrelic_agent.log by default) may contain WARN entries such as the following:
WARN : Segment: Nested/Controller/active_storage/blobs/redirect/show was unfinished at the end of transaction. Timing information for this segment'sparent Middleware/Rack/ActionDispatch::Routing::RouteSet/call in Controller/active_storage/blobs/redirect/show may be inaccurate.
What this warning means is that the New Relic Ruby agent is about to finish up reporting on a RouteSet#call transaction and stop the stopwatch, even though the agent realizes that the underlying Ruby on Rails application may still be involved in completing various asynchronously conducted operations that could technically be considered a part of the same transaction.
Note the following:
- While the example above refers to
Nested/Controller/active_storage/blobs/redirect/show, this warning is not at all ActiveStorage specific and can appear for any type of transaction - The "may" part of this warning represents some pretty cautious behavior on the part of the agent. We have been able to produce this warning when the timing information is indeed complete and accurate.
- This warning is more likely to appear when there are multiple Ruby threads involved in handling a given operation. In our case we were able to reproduce this warning by spawning a new
Threadand callingjoinon it and making sure its work was complete. Even though the thread has been joined and is effectively done working, the New Relic Ruby agent is aware that the joined thread has not yet been garbage collected. At this time, the agent is not able to differentiate between threads that are done processing / waiting to be reaped and threads that are still active and unfinished when it comes time to stop the stopwatch. - For ActiveStorage in particular, the warning may be more likely to appear if one underlying asynchronous process either takes more time or utilizes more threads than another. For example, in switching between a local storage based setup to an AWS S3 one, the AWS S3 one would be more likely to see the warning.
Given these items, these warnings can safely be ignored by the Rails application we used to investigate this issue, as the timing info was always correct. But for real world production applications, it remains possible that this warning could indicate that the Rails application is still busy working on something at the time the stopwatch is stopped. For any individual application whose RouteSet#call timing is thought to be inaccurate, users can work with New Relic support on the specifics of their situation.
"Response time" is lower than the overall transaction time
From the screenshot that @developius shared, there is a "Response time" metric (represented by the darkest of the blues on the graph) that is notably lower than the largest amount of time shown for an overall operation (in the case of the screenshot, the overall operation was an ActiveStorage ProxyController call.
In our testing, this situation of having "Response time" not be the largest timing number is correct and expected; while admittedly it can come across as confusing and perhaps even subjectively not what is desired.
What is happening is that "Response time" measures wall clock time. In the context of a Ruby on Rails action being carried out, how much human observed time elapsed before a response came back?
The other values on the graph measure total system and/or CPU time. If 3 threads were involved in a Rails operation and all ran asynchronously and each took 1 second to complete, the wall clock time would be 1 second while the system time would be 3 seconds. This is why the "Response time" value can show up as having a smaller value on the web UI graphs when asynchronous logic is involved by the observed application.
To demonstrate this issue, here is an example Ruby on Rails controller method:
  def index
    threads = []
    3.times do
      threads << Thread.new { sleep 1 }
    end
    threads.each(&:join)

    @cogs = Cog.all
  end
Assuming that the ActiveRecord Cog.all operation takes 1 second to complete, the New Relic Ruby agent will report that a single invocation of this controller method...
- Took 2 seconds in the "Response time" part of the graph. The threading work took 1 second, and the ActiveRecord call took 1 second, and the client had a response back in 2 seconds total.
- Took 4 seconds in the "RouteSet#call` part of the graph. The threading work took 3 x 1 second and the ActiveRecord call took 1 second. There was 4 seconds spent on engaging the system/CPU even though the controller responded in 2 seconds.
Interestingly, this trivial controller code is also capable of reproducing the WARN message in the logs mentioned in the previous section, because the New Relic transaction is finishing up while the individual Thread instances still exist even though they are done working.
Note that by default the "Response time" value is produced from an average of multiple sets of data.
For any observed application that appears to have any incorrect timing values beyond the difference between wall clock and CPU/system time, users can work with New Relic support to go over the specifics.
The Future of the New Relic Ruby agent
As the Ruby community itself continues to progress by having its applications be more asynchronous and concurrent in nature, we are constantly looking into ways for the New Relic Ruby agent to better operate within and measure these contexts. The Ruby agent dev team is staffed exclusively by individuals who are passionate about Ruby, participate in conferences (check out our recordings from the recent RailsConf 2022!), and engage actively and passively with the Ruby community as much as possible.
The items described here in this Issue all pertain to an observed application doing multiple things concurrently. As we continue to improve how the agent behaves in and reports on concurrent environments, we hope to continue to drive relevant aggregation / UI changes in the future.
We very much encourage and celebrate feedback that helps us know where our users would most prefer that we focus our efforts.