newrelic-ruby-agent
 newrelic-ruby-agent copied to clipboard
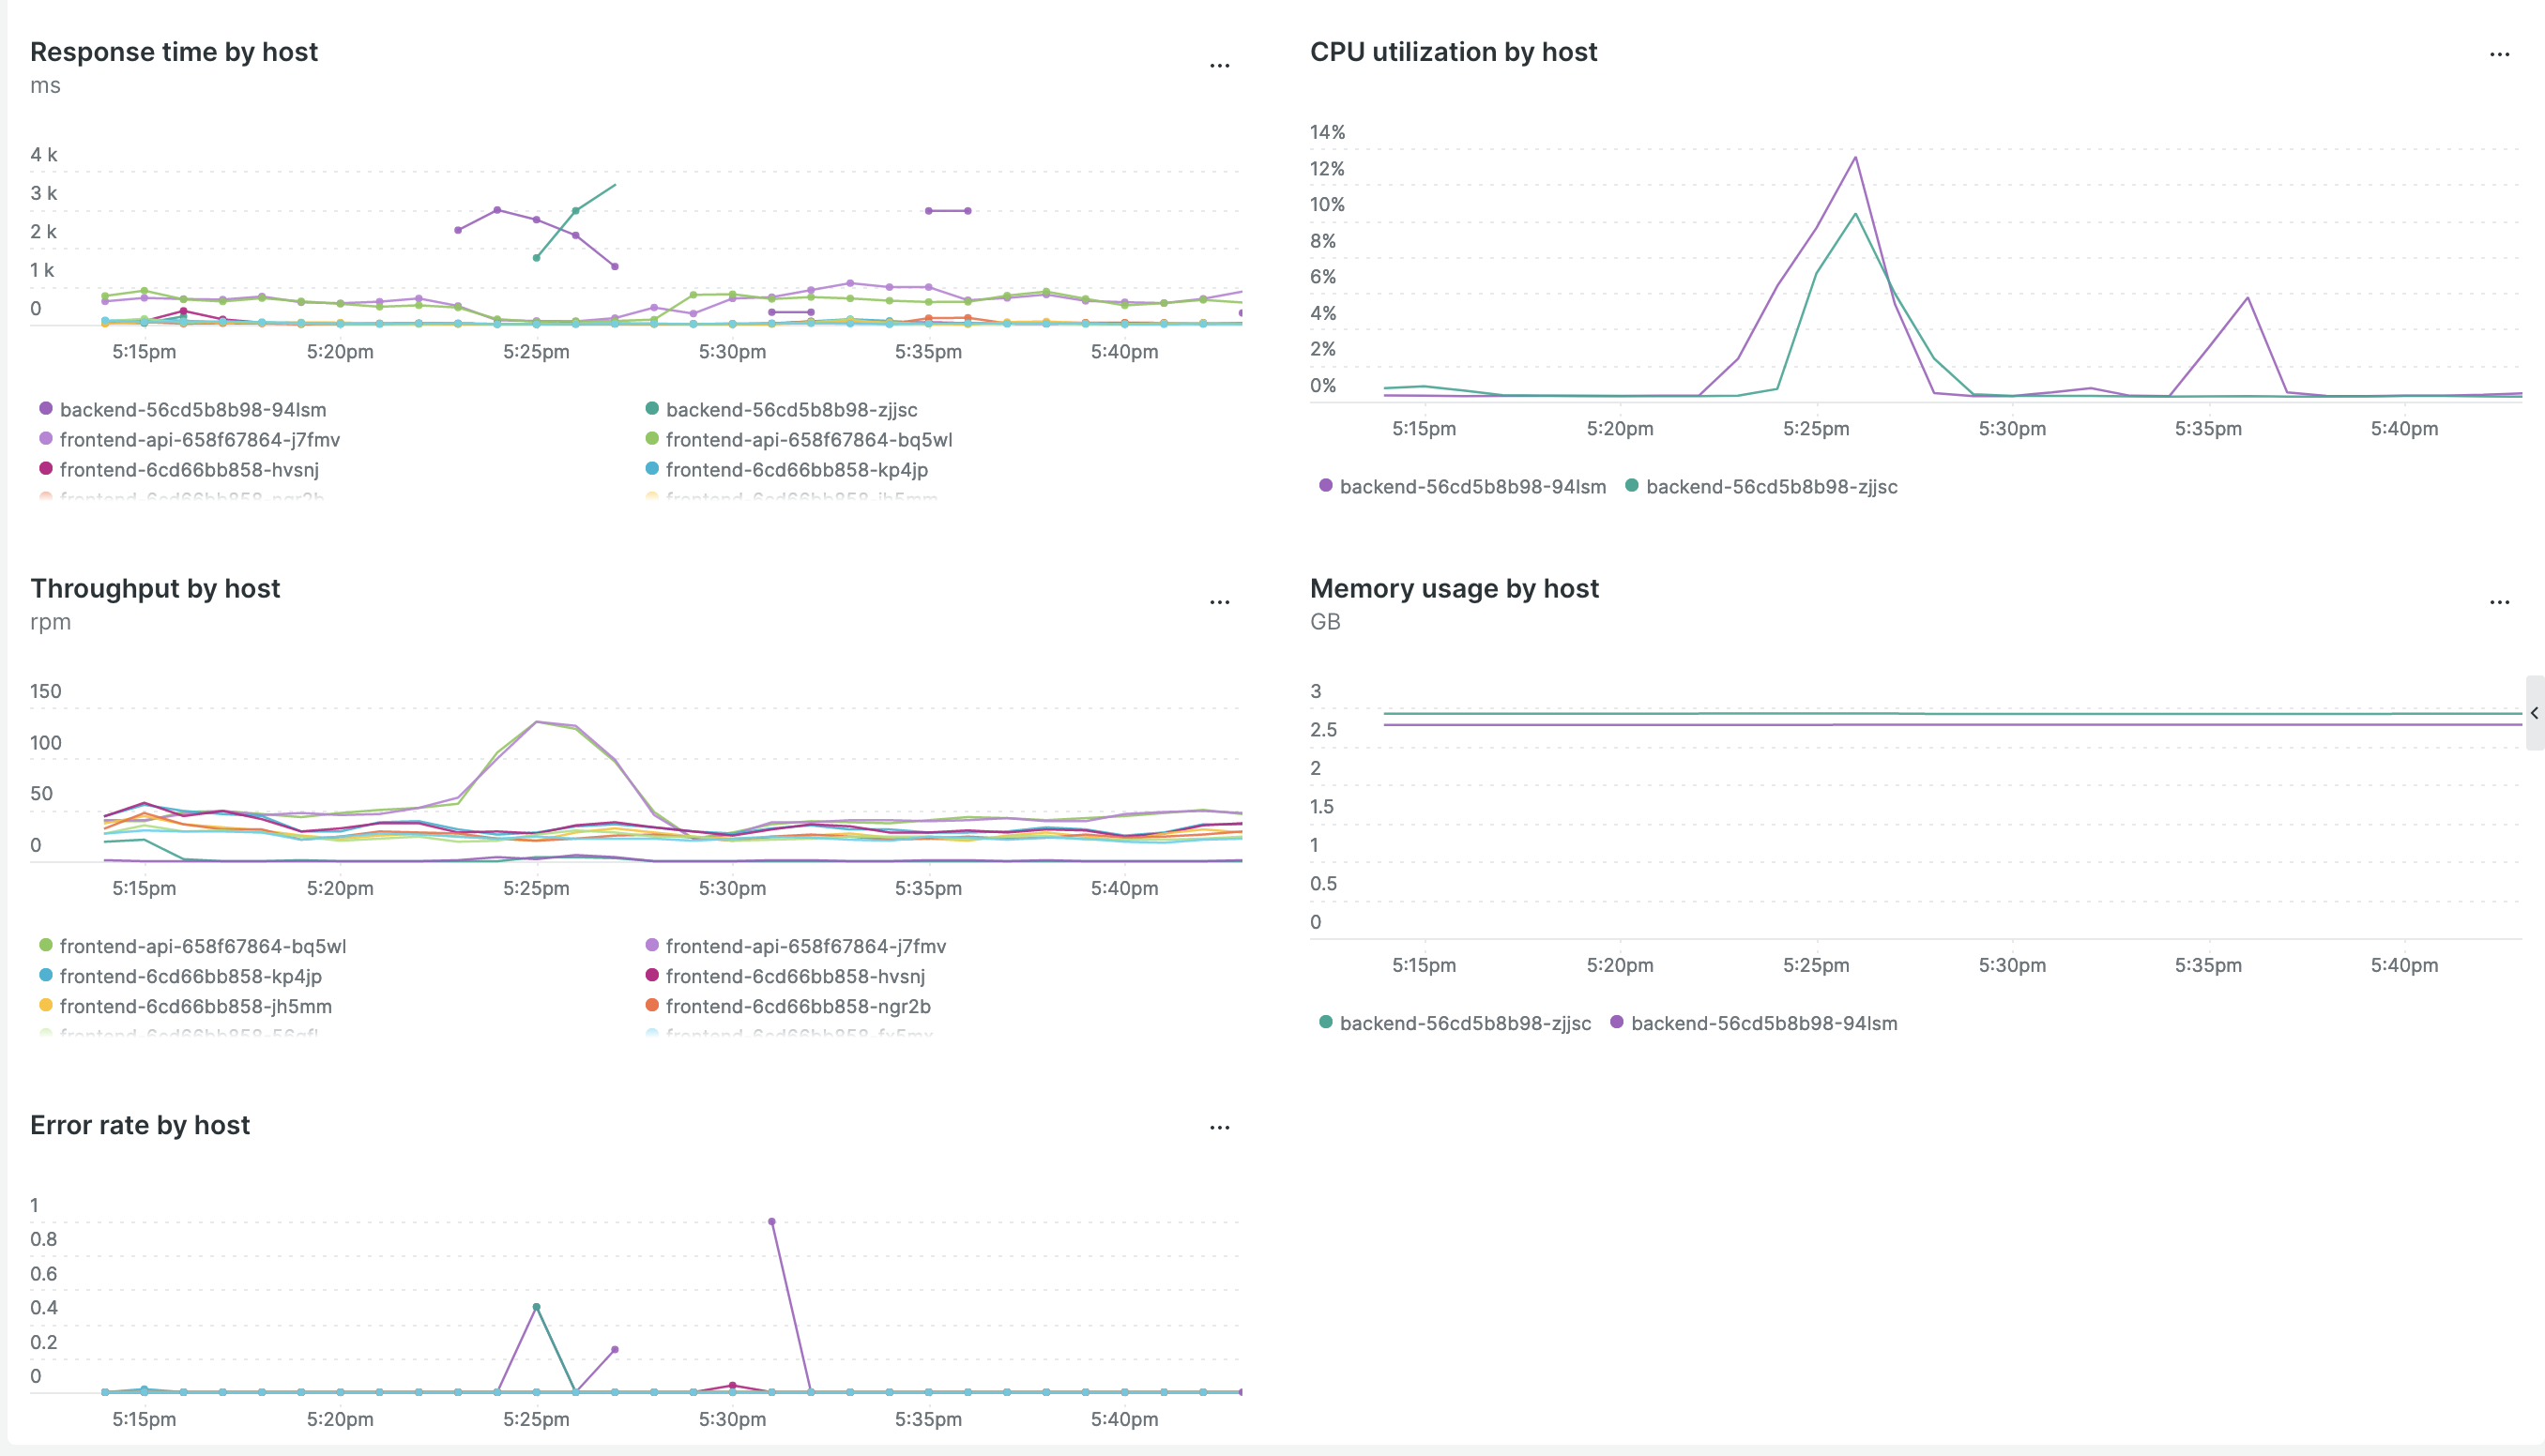
CPU utilization and Memory usage by host missing on frontend pods
^^ Provide a general summary of the issue in the title above. ^^
Description
In the APM Summary dashboard, CPU utilization and Memory usage by host missing on frontend pods, though this data is present for the backend ones - see the screenshot:
Expected Behavior
Expected to see the charts for the frontend pods as well
[Troubleshooting]
Here's a suspected failure on Puma middleware tracing try from the NR agent debug log:
[2022-08-03 23:04:09 +0000 frontend-f45dc9c7f-l6wfn (1)] DEBUG : Creating Ruby Agent worker thread.
[2022-08-03 23:04:09 +0000 frontend-f45dc9c7f-l6wfn (1)] DEBUG : Creating New Relic thread: Worker Loop
[2022-08-03 23:04:09 +0000 frontend-f45dc9c7f-l6wfn (1)] DEBUG : Connecting Process to New Relic: /bundle/ruby/2.7.0/bin/puma
[2022-08-03 23:04:09 +0000 frontend-f45dc9c7f-l6wfn (1)] DEBUG : NameError : wrong constant name rails - when accessing config key agent_enabled
[2022-08-03 23:04:10 +0000 frontend-f45dc9c7f-l6wfn (1)] ERROR : Exception during Transaction#finish
[2022-08-03 23:04:10 +0000 frontend-f45dc9c7f-l6wfn (1)] ERROR : NoMethodError: undefined method `name' for nil:NilClass
[2022-08-03 23:04:10 +0000 frontend-f45dc9c7f-l6wfn (1)] DEBUG : Debugging backtrace:
/bundle/ruby/2.7.0/gems/newrelic_rpm-8.9.0/lib/new_relic/agent/transaction/abstract_segment.rb:231:in `force_finish'
  /bundle/ruby/2.7.0/gems/newrelic_rpm-8.9.0/lib/new_relic/agent/transaction/abstract_segment.rb:89:in `finalize'
  /bundle/ruby/2.7.0/gems/newrelic_rpm-8.9.0/lib/new_relic/agent/transaction/tracing.rb:52:in `block in finalize_segments'
  /bundle/ruby/2.7.0/gems/newrelic_rpm-8.9.0/lib/new_relic/agent/transaction/tracing.rb:52:in `each'
  /bundle/ruby/2.7.0/gems/newrelic_rpm-8.9.0/lib/new_relic/agent/transaction/tracing.rb:52:in `finalize_segments'
  /bundle/ruby/2.7.0/gems/newrelic_rpm-8.9.0/lib/new_relic/agent/transaction.rb:550:in `commit!'
  /bundle/ruby/2.7.0/gems/newrelic_rpm-8.9.0/lib/new_relic/agent/transaction.rb:529:in `finish'
  /bundle/ruby/2.7.0/gems/newrelic_rpm-8.9.0/lib/new_relic/agent/instrumentation/middleware_tracing.rb:112:in `call'
  /bundle/ruby/2.7.0/gems/puma-5.6.4/lib/puma/configuration.rb:252:in `call'
  /bundle/ruby/2.7.0/gems/puma-5.6.4/lib/puma/request.rb:77:in `block in handle_request'
  /bundle/ruby/2.7.0/gems/puma-5.6.4/lib/puma/thread_pool.rb:340:in `with_force_shutdown'
  /bundle/ruby/2.7.0/gems/puma-5.6.4/lib/puma/request.rb:76:in `handle_request'
  /bundle/ruby/2.7.0/gems/puma-5.6.4/lib/puma/server.rb:441:in `process_client'
  /bundle/ruby/2.7.0/gems/puma-5.6.4/lib/puma/thread_pool.rb:147:in `block in spawn_thread'
  /bundle/ruby/2.7.0/gems/newrelic_rpm-8.9.0/lib/new_relic/agent/tracer.rb:414:in `block in thread_block_with_current_transaction'
Steps to Reproduce
This is from a running staging environment:
Account: 1521341
The https://app.development-0... service.
Your Environment
NR Ruby agent: 8.9.0 Ruby v. 2.7.6 Rails v 6.1.6.1
For Maintainers Only or Hero Triaging this bug
Suggested Priority (P1,P2,P3,P4,P5): Suggested T-Shirt size (S, M, L, XL, Unknown):
Tried to run with the fix of parent.name if parent - no success.
The log now says:
[2022-08-04 11:55:22 +0000 frontend-75f56499fc-scqbc (1)] DEBUG : Creating Ruby Agent worker thread.
[2022-08-04 11:55:22 +0000 frontend-75f56499fc-scqbc (1)] DEBUG : Creating New Relic thread: Worker Loop
[2022-08-04 11:55:22 +0000 frontend-75f56499fc-scqbc (1)] DEBUG : Connecting Process to New Relic: /bundle/ruby/2.7.0/bin/puma
[2022-08-04 11:55:22 +0000 frontend-75f56499fc-scqbc (1)] DEBUG : NameError : wrong constant name rails - when accessing config key agent_enabled
[2022-08-04 11:55:22 +0000 frontend-75f56499fc-scqbc (1)] WARN : Segment: Controller/Rack/****::Application/call was unfinished at the end of transaction. Timing information for this segment'sparent  in Controller/health/index may be inaccurate.
[2022-08-04 11:55:22 +0000 frontend-75f56499fc-scqbc (1)] WARN : Segment: Ruby/Thread/153680 was unfinished at the end of transaction. Timing information for this segment's parent Middleware/Rack/ActionDispatch::Static/call in Controller/health/index may be inaccurate.
Thanks for letting us know about this issue. Having thread tracing enabled isn't expected to have that kind of impact on reporting, so it's possible there may be a bug in there somewhere. I have a couple of questions about your application to see if we can get a better idea of the issue. I'm going to re open this issue because I'd like us to investigate this behavior.
- Are you using the infinite tracing version of the ruby agent?
- You mentioned not having this problem on your backend servers, is thread tracing enabled there?
- I see the parent of the thread segment in your log snippets is coming from ActionDispatch, how are you using threads in your application in general (and if there is a difference with the frontend vs backend, that would be great to know those differences)
- Do you have any constants listed in the config option
autostart.denylisted_constants? - Are you missing other unscoped metrics, or is it just those ones? If you aren't sure, one way to check this that should be pretty straightforward is to navigate to the metrics explorer and search for
supportability/invoke_remote_serialize/analytic_event_data, select count in the dropdown next to the metric and see if it is present. This is an unscoped metric that I would expect to always be present for almost all applications. Here is a screenshot of me searching for that metric on a test app I fired up briefly to help explain what I mean.
Thank you!
Thanks for letting us know about this issue. Having thread tracing enabled isn't expected to have that kind of impact on reporting, so it's possible there may be a bug in there somewhere. I have a couple of questions about your application to see if we can get a better idea of the issue. I'm going to re open this issue because I'd like us to investigate this behavior.
* Are you using the infinite tracing version of the ruby agent? * You mentioned not having this problem on your backend servers, is thread tracing enabled there? * I see the parent of the thread segment in your log snippets is coming from ActionDispatch, how are you using threads in your application in general (and if there is a difference with the frontend vs backend, that would be great to know those differences) * Do you have any constants listed in the config option `autostart.denylisted_constants`? * Are you missing other unscoped metrics, or is it just those ones? If you aren't sure, one way to check this that should be pretty straightforward is to navigate to the metrics explorer and search for `supportability/invoke_remote_serialize/analytic_event_data`, select count in the dropdown next to the metric and see if it is present. This is an unscoped metric that I would expect to always be present for almost all applications. Here is a screenshot of me searching for that metric on a test app I fired up briefly to help explain what I mean. Thank you!
Hello!
- I'm not using the infinite tracing version of the ruby agent
- Yes, thread tracing was enabled at the backend pods as well
- There is Puma on the frontend pod, running with 1 process and 2 threads, and on the backend we have no web-server, only the DelayedJob with 32 workers
- Yes,
autostart.denylisted_constants: "rails::console" - Yes, the
supportability/invoke_remote_serialize/analytic_event_datametric is displayed
Glad to be of some help!