micrometer-registry-newrelic
 micrometer-registry-newrelic copied to clipboard
Report Traces and Metrics from Quarkus with NewRelic Metric Registry
We're a New Relic customer and are currently using the Java Agent with APM in the EU hosted New Relic.
We'd like to upgrade our web services to Quarkus, using Open Telemetry to publish metrics and traces to New Relic with the new APM-like view 'Services - OpenTelemetry':
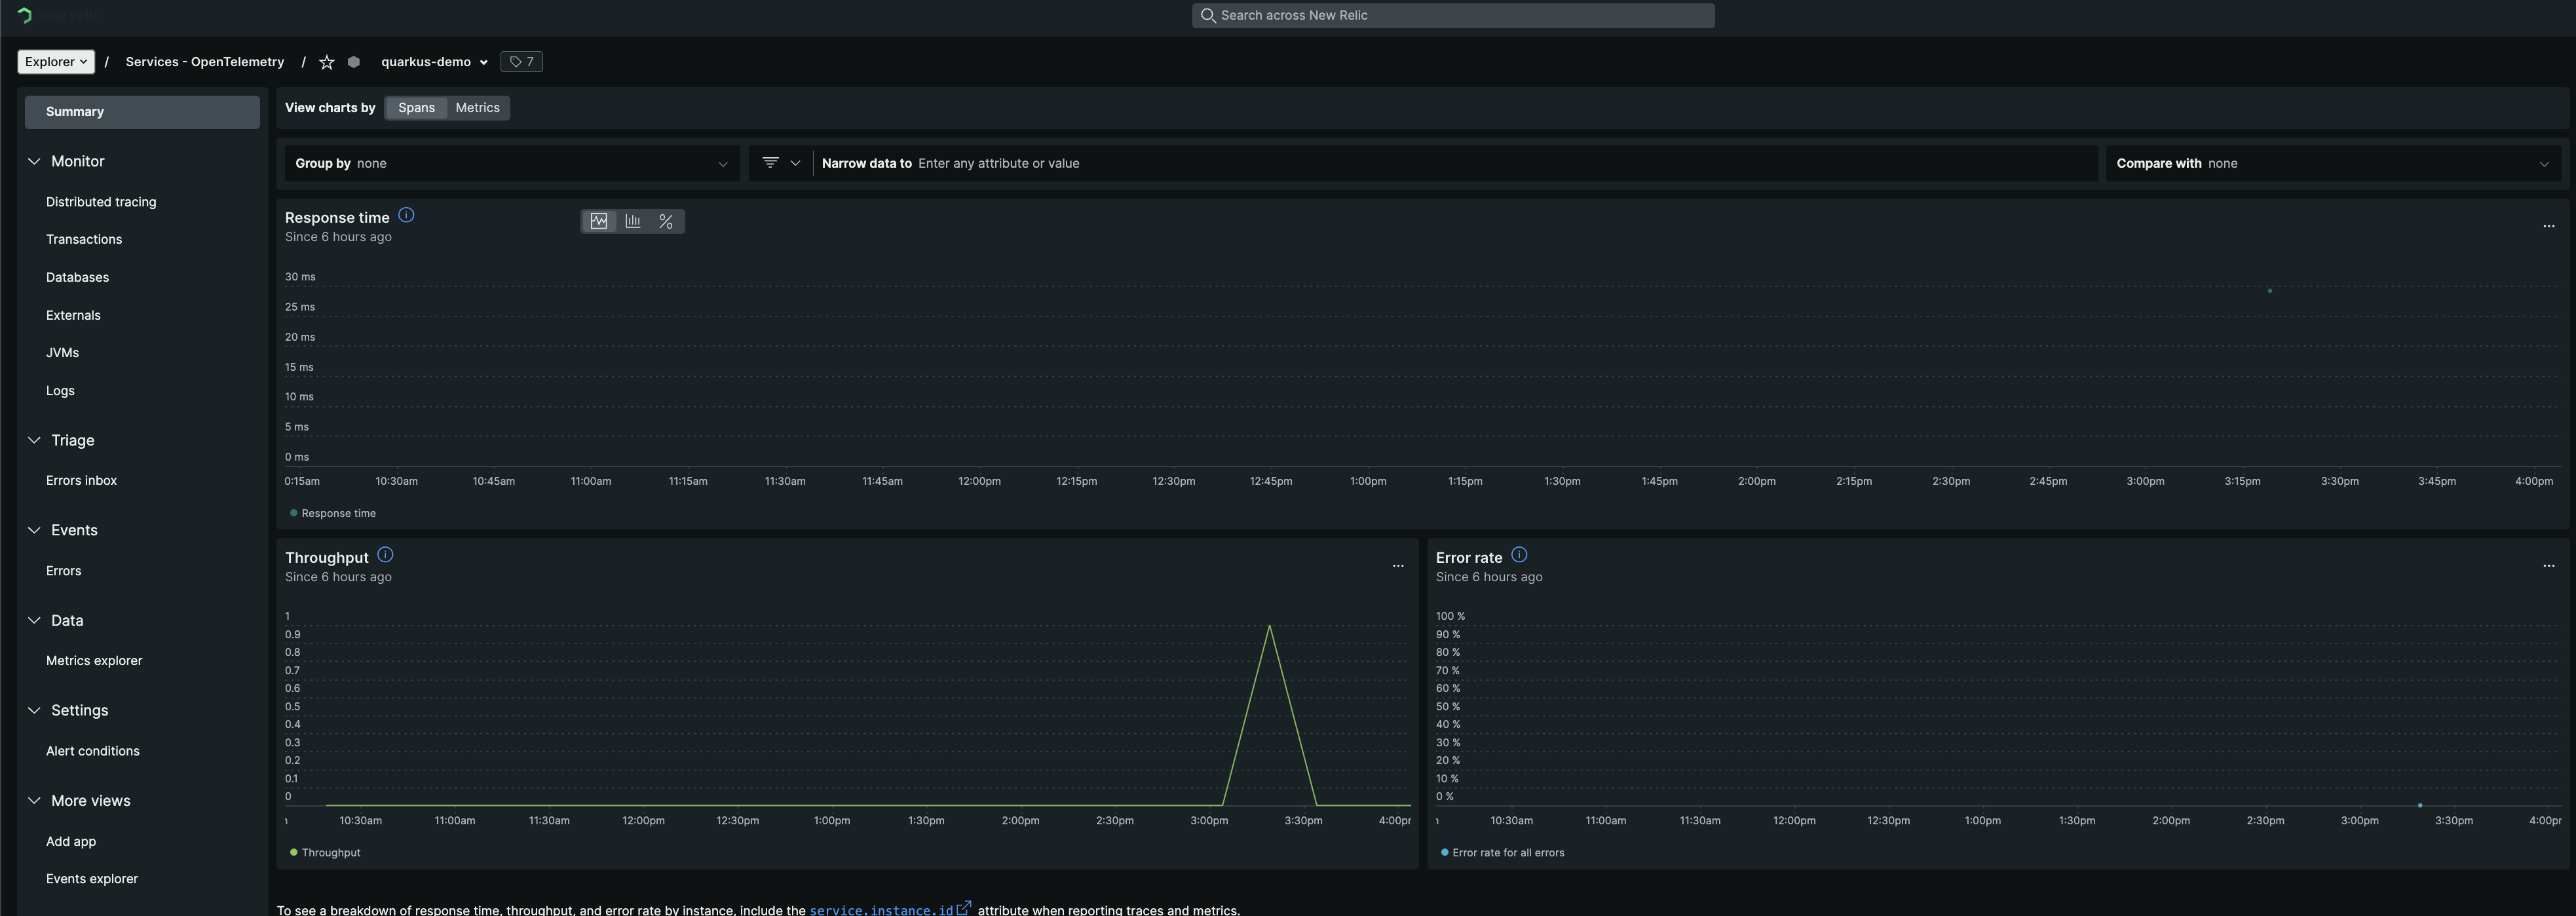
This looks like it should perfectly suit us, and have similar views and capabilities to those we currently enjoy with APM.
However I have not yet been able to get this view to be populated correctly from a Quarkus project.
To demonstrate the issue I've created a public demo GitHub project here: https://github.com/luketn/quarkus-demo-opentelemetry-newrelic
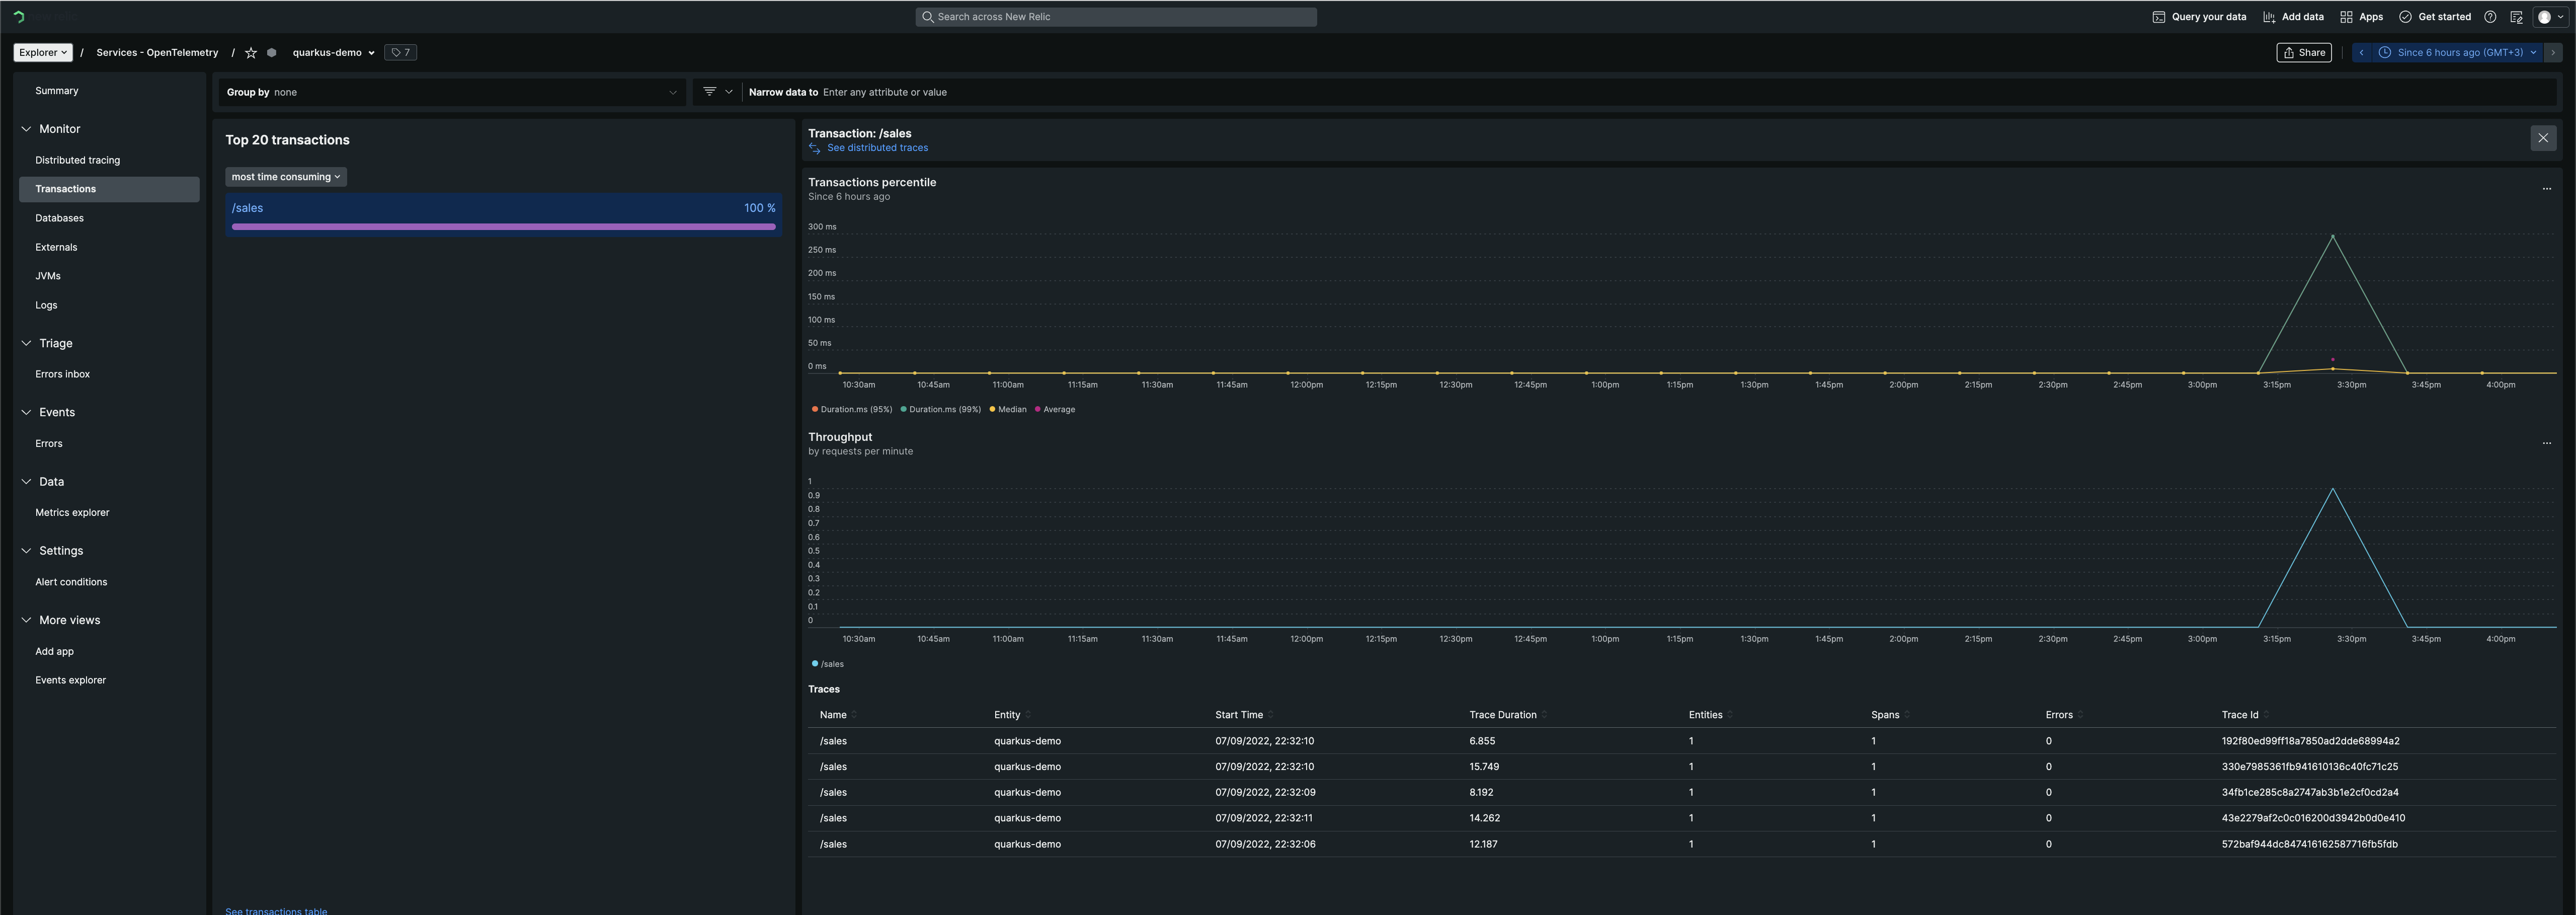
Using the out-of-the-box config, I started to see traces for requests - awesome!
Configured with:
# Send traces to New Relic
%test.quarkus.opentelemetry.tracer.exporter.otlp.enabled=false
quarkus.opentelemetry.tracer.exporter.otlp.enabled=true
quarkus.opentelemetry.tracer.exporter.otlp.headers=api-key=${NEW_RELIC_API_KEY:123}
quarkus.opentelemetry.tracer.exporter.otlp.endpoint=https://otlp.eu01.nr-data.net:4317
quarkus.opentelemetry.tracer.resource-attributes=service.name=quarkus-demo,service.version=0.0.1,deployment.environment=dev
However, for errors in traces I don't see stack traces. E.g. this timeout exception just shows an unhelpful 'no status description was provided':
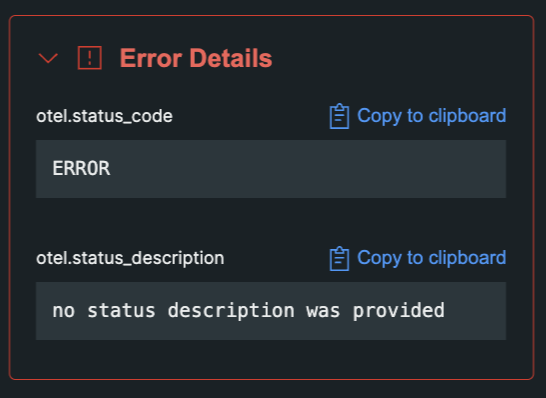
But at least traces are showing up - it's a start.
For metrics I had much less luck.
Micrometer is Quarkus's recommended way to ship metrics from your service in open telemetry formats. "Micrometer is the recommended approach to metrics for Quarkus." https://quarkus.io/guides/micrometer
There is a New Relic micrometer registry extension which allows you to bring in and configure New Relic's own Open Telemetry micrometer registry: Quarkus Extension: https://github.com/quarkiverse/quarkus-micrometer-registry NewRelic Library used by the Extension: https://github.com/newrelic/micrometer-registry-newrelic
I tried two approaches to send metric data to sending metrics.
Approach 1
First using the recommended Quarkus extension: https://quarkiverse.github.io/quarkiverse-docs/quarkus-micrometer-registry/dev/micrometer-registry-newrelic-telemetry.html
    <dependency>
      <groupId>io.quarkiverse.micrometer.registry</groupId>
      <artifactId>quarkus-micrometer-registry-newrelic-telemetry</artifactId>
      <version>2.11.0</version>
    </dependency>
Configured with:
# Send metrics to New Relic
%test.quarkus.micrometer.enabled=false
quarkus.micrometer.enabled=true
quarkus.micrometer.export.newrelic.telemetry.api-key=${NEW_RELIC_INSIGHTS_API_KEY:123}
quarkus.micrometer.export.newrelic.telemetry.uri=https://insights-collector.eu01.nr-data.net/v1/accounts/events
I see the log entries indicating the registry was started, but I don't see any data reported in New Relic:
22:31:14 INFO  traceId=, parentId=, spanId=, sampled= [co.ne.te.tr.BatchDataSender] (Quarkus Main Thread) BatchDataSender configured with endpoint https://insights-collector.eu01.nr-data.net/v1/accounts/events
  22:31:35 INFO  traceId=, parentId=, spanId=, sampled= [co.ne.te.tr.BatchDataSender] (Quarkus Main Thread) BatchDataSender configured to use insights keys
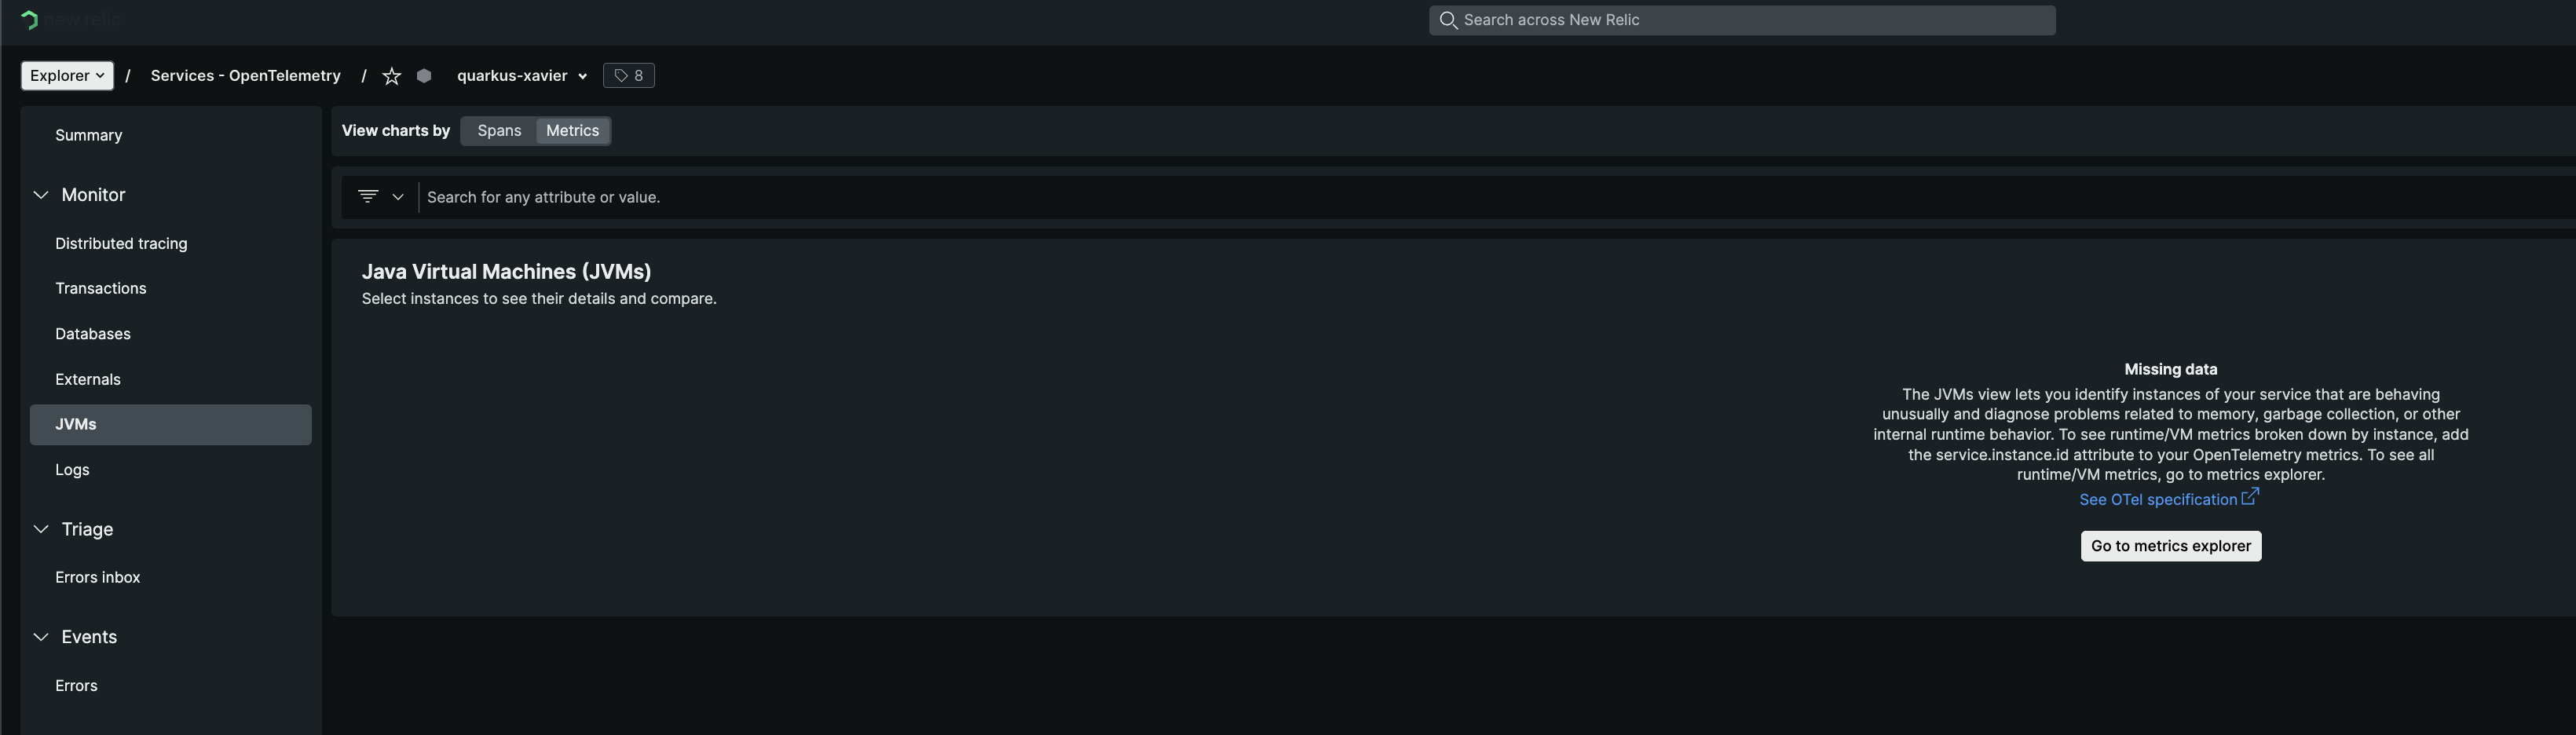
To be clear, I'm expecting to see the JVM metrics being reported by Quarkus, and showing up in the JVM view:
Approach 2
Next I tried implementing a custom producer instead of the New Relic Quarkiverse extension, as documented here: https://quarkus.io/guides/micrometer#creating-a-customized-meterregistry
This has the benefit of allowing more properties to be configured, including the use of a metrics API endpoint and key instead of the insights one. Not sure if this is a good thing or not, but I have the impression metrics is the preferred API to use so thought I would try it. You can also specify other attributes here, which I think might be useful in assigning the metrics to the right application (if you don't specify an application name for example, how would the metrics arrive in the right service view?).
You can see this implementation on the branch: https://github.com/luketn/quarkus-demo-opentelemetry-newrelic/tree/custom-producer
This uses the dependencies:
    <dependency>
      <groupId>com.newrelic.telemetry</groupId>
      <artifactId>micrometer-registry-new-relic</artifactId>
      <version>0.10.0</version>
    </dependency>
    <dependency>
      <groupId>io.quarkus</groupId>
      <artifactId>quarkus-micrometer</artifactId>
    </dependency>
And is configured in the code with:
package com.example;

import com.newrelic.telemetry.Attributes;
import com.newrelic.telemetry.micrometer.NewRelicRegistry;
import com.newrelic.telemetry.micrometer.NewRelicRegistryConfig;
import io.quarkus.arc.Priority;
import org.jboss.logging.Logger;

import javax.enterprise.inject.Alternative;
import javax.enterprise.inject.Produces;
import javax.inject.Singleton;
import javax.interceptor.Interceptor;

@Singleton
public class NewRelicRegistryProducer {
    private static Logger log = Logger.getLogger(NewRelicRegistryProducer.class);

    @Produces
    @Singleton
    @Alternative
    @Priority(Interceptor.Priority.APPLICATION + 100)
    public NewRelicRegistry registry() {
        String new_relic_license_key = System.getenv("NEW_RELIC_API_KEY");
        if (new_relic_license_key == null || new_relic_license_key.isBlank()) {
            log.warn("NEW_RELIC_API_KEY is not set, so New Relic metrics will not be sent.");
            return null;
        }
        return NewRelicRegistry.builder(new NewRelicRegistryConfig() {
                    @Override
                    public String get(String key) {
                        log.info("NewRelic registry config being read: key %s".formatted(key));
                        return switch (key) {
                            case "newrelic.apiKey" -> new_relic_license_key;
                            case "newrelic.uri" -> "https://metric-api.eu.newrelic.com/metric/v1";
                            case "newrelic.step" -> "1m";
                            default -> null;
                        };
                    }

                    @Override
                    public boolean useLicenseKey() {
                        return true;
                    }

                    @Override
                    public boolean enableAuditMode() {
                        return false;
                    }
                })
                .commonAttributes(new Attributes()
                        .put("service.name", "quarkus-demo")
                        .put("service.version", "1.0.0")
                        .put("service.instance.id", "1")
                        .put("deployment.environment", "dev")
                )
                .build();
    }
}
End result is the same in approach 2 - no metrics are in the UI.
I also don't see any metrics for the JVM here in the metrics explorer:
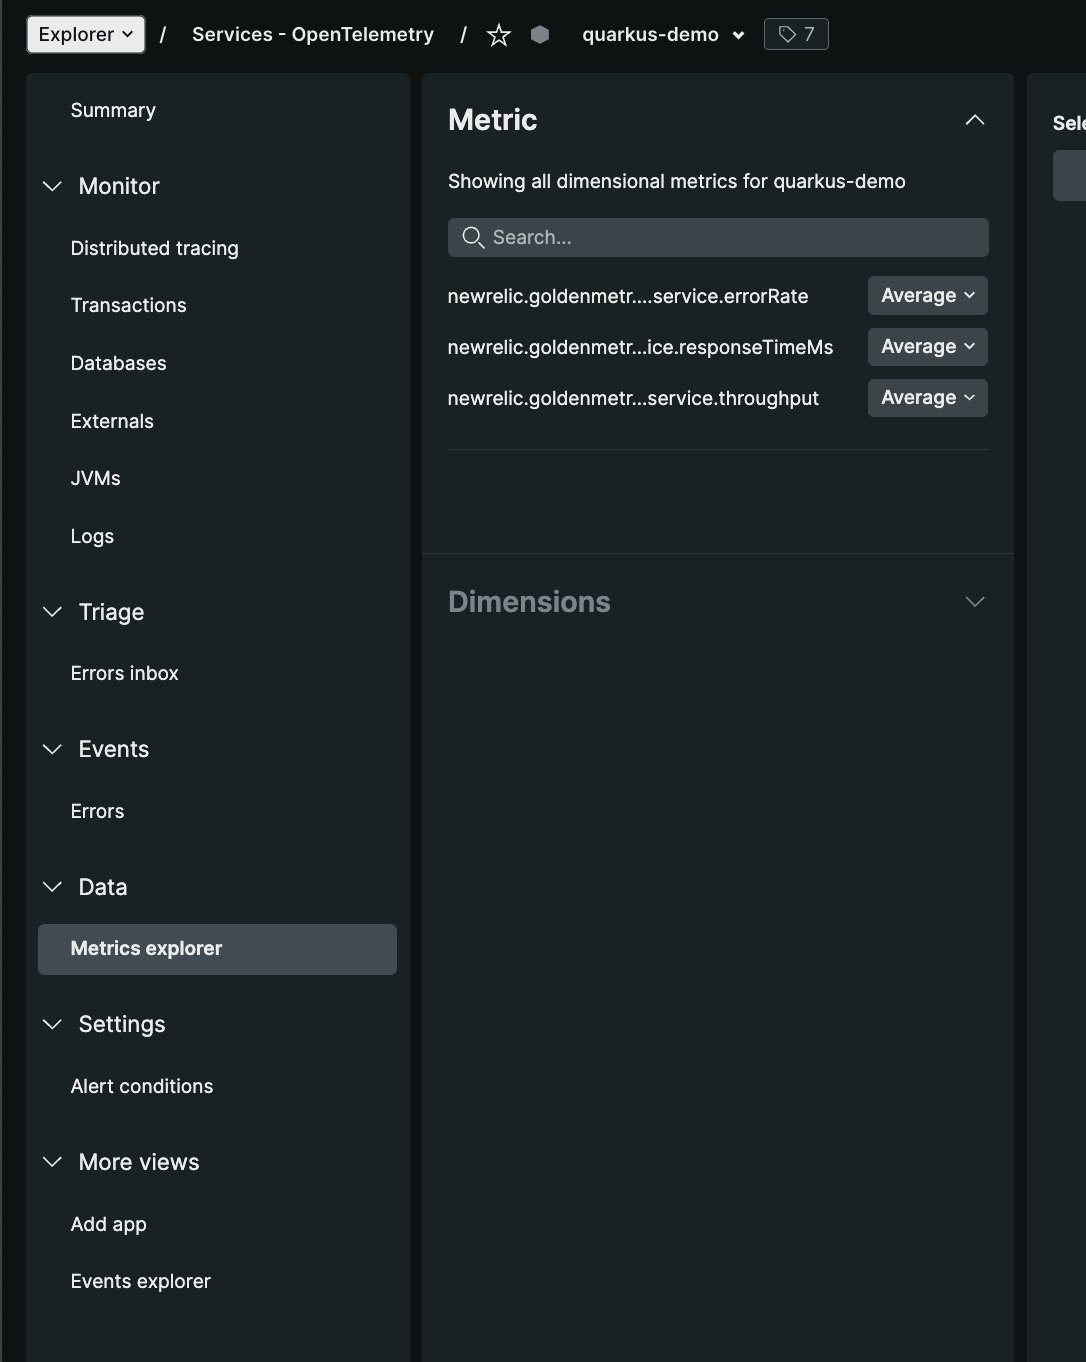
We'd really appreciate some help with this, ideally with an example project showing how to fully populate the Services - OpenTelemetry view from a Quarkus application.
Thanks!
(Migrate to Jira)