grafana-prtg

grafana-prtg copied to clipboard
multi column sensor problem
hello,
i want to make a visual on last value (speed), (also i dont need volume )
after i created widget on
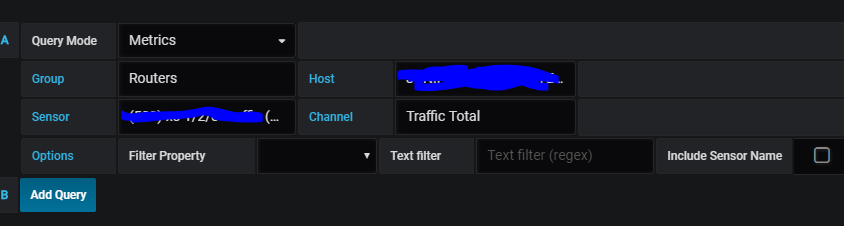
i see like this
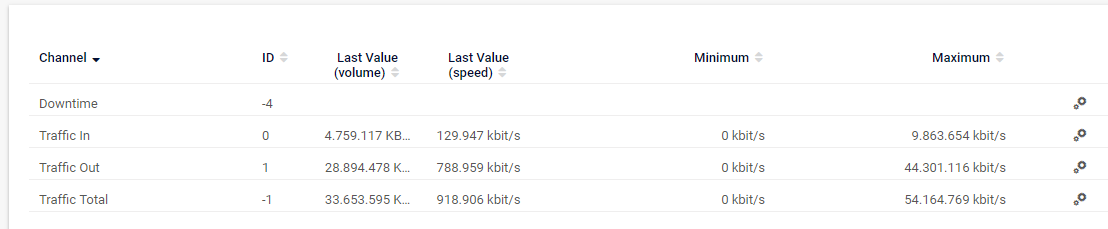
and this is the raw data
first problem.
how can i make a proper widget with correct value ?
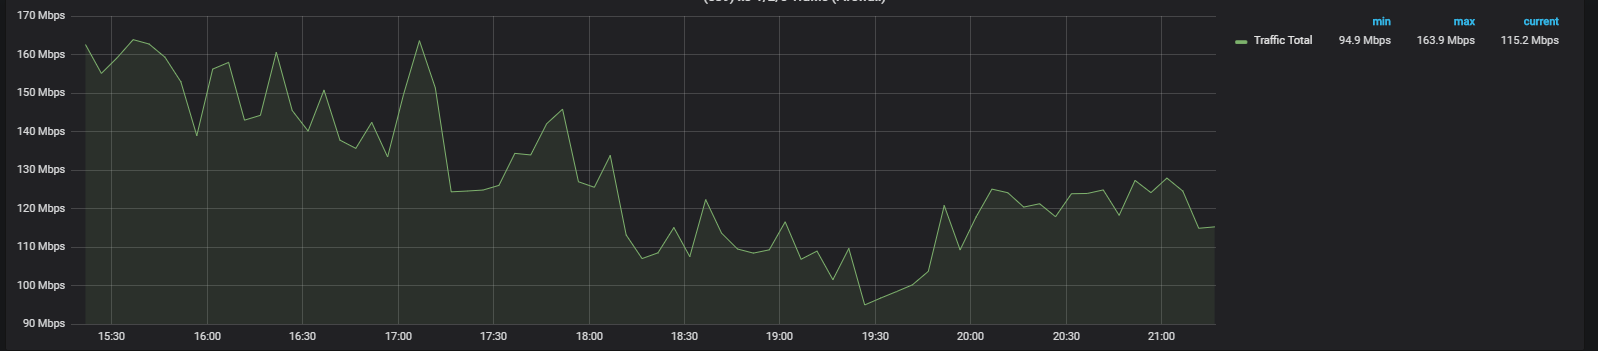
second problem is
there's a difference on raw data and grafana data. how can fix this ?
raw is : 921.829 kbit/s widget : 118.2 mbps
thanks.
Download the development version. It has a correct multiplier to fix that.
Same issue here. I tried the developmental version multiplier and while I can see the field, multiplying doesn't work. That is with the latest grafana 5.0.3 version and latest PRTG. I'm considering installing the previous grafana version just to test it.
EDIT. Clearing browser cache fixed my issue!