grafana-prtg
 grafana-prtg copied to clipboard
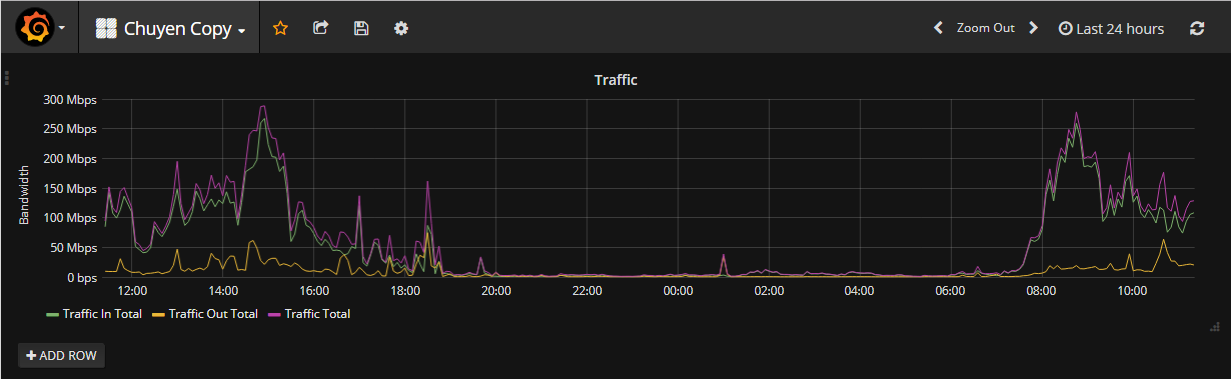
Factory sensor - Values only show correctly if time range > 24h
I'm using development branch,
If I select time range <24h, Grafana displays incorrect values and all channels on the factory sensors show the same value.
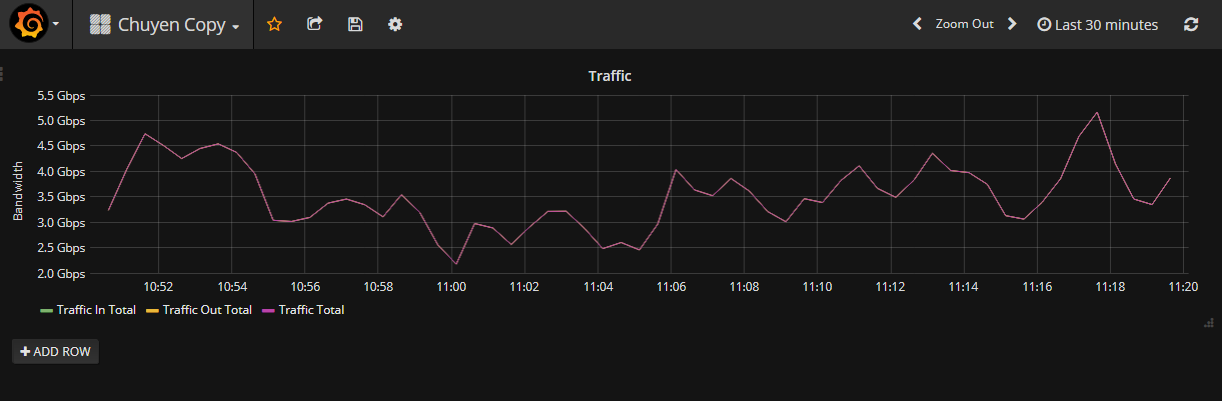 If I select time range >24h, it seems work well
i have simular issue,
https://github.com/neuralfraud/grafana-prtg/issues/75
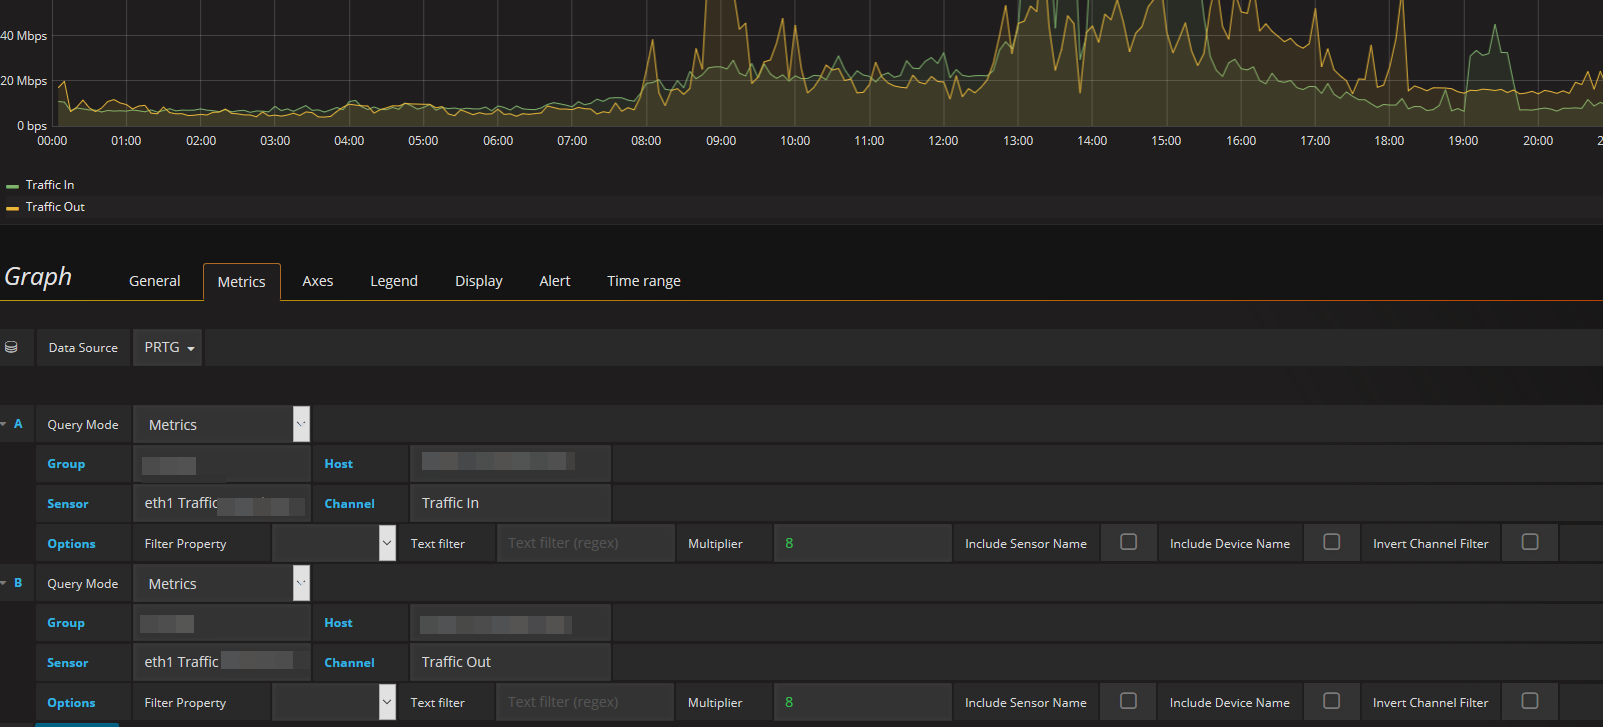
@chuyendang can you please show the Metrics for your Dashboard. Have you Try just the Traffic Sensors, have they work?
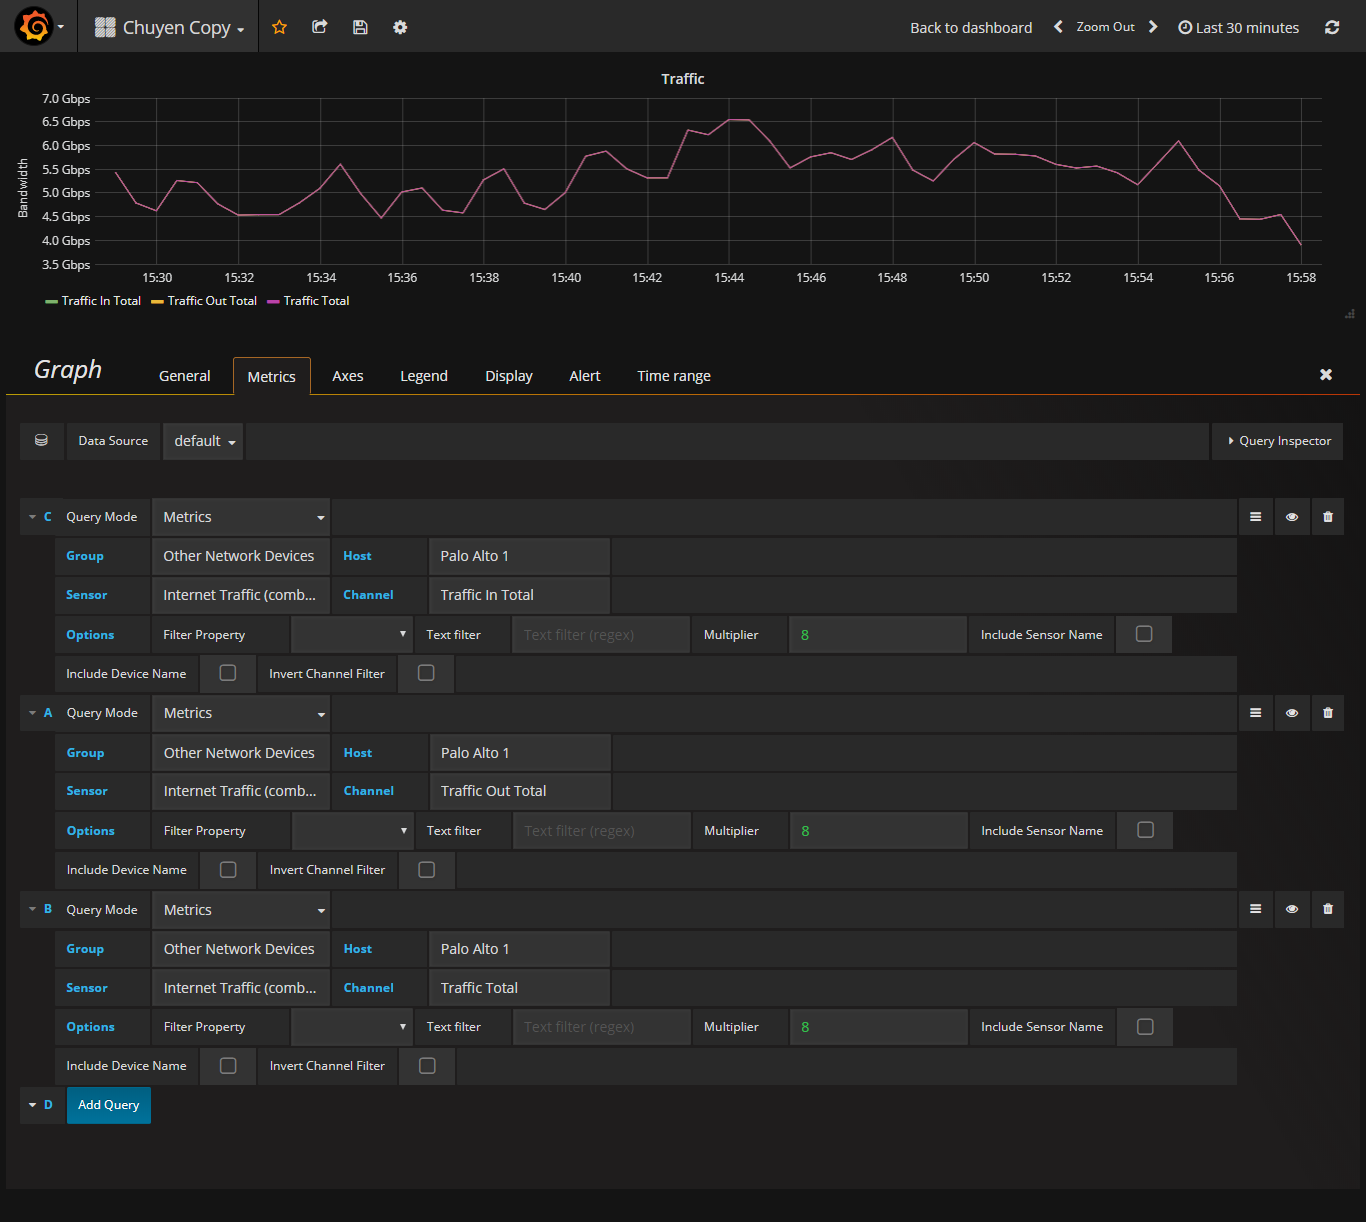 It works well with the SNMP sensor
I have the same issue. Althoug mine is <12h. The values change completely, Im using factory sensors too.
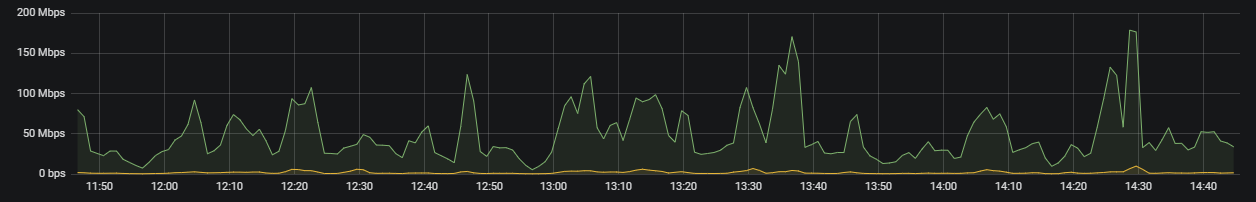
Last 3 hours
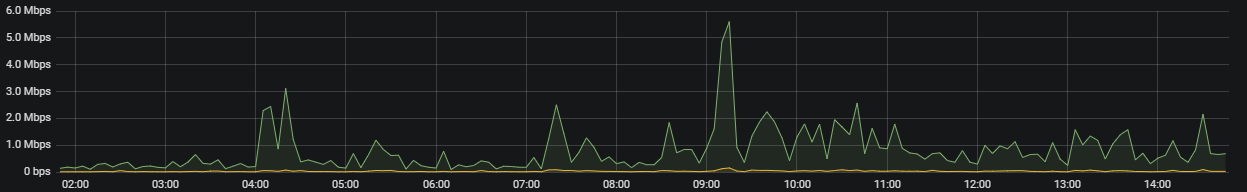
Last 13 hours
We know if it's a bug or missing configuration?
Thanks
I am having the same issue. All the channels in Grafana show the same results of only Channel #1.