netdata
 netdata copied to clipboard
Logs Management
Table of Contents
- Summary
- Design Overview
- Configuration
- Custom charts based on regex parsers
- Configuration Examples
- Log Collection
- Tail_plugin.c
- FLB_plugin.c
- Buffering
- Parsing
- Database Storage
- Querying
- Configuration
- Test Plan
- Unit Tests
- Performance
- External Dependencies / Packaging
- TODO
Summary
This is a sizeable PR that adds logs management functionality to the agent, including:
- web access log (Apache and NGINX) collection,
- Systemd log collection,
- Docker events log collection,
- compression of collected logs using LZ4,
- parsing of collected logs for metrics extraction and chart generation,
- buffering,
- storage to disk,
- querying.
The implemented logs management engine is a separate entity to the DBengine. Almost all of the code resides in the following 2 places:
Design Overview
This PR introduces 2 new static threads which are implemented by the following functions: logsmanagement_plugin_main() and logsmanagement_main(). The first one is responsible for using the extracted metrics to populate the dashboard charts and the second one takes care of everything else (that is, initialising all the necessary subsystems and spawning children threads, before executing its own event loop).
The digested logs generally follow this pipeline:

Configuration
There is a new section introduced in netdata.conf:
[logs management]
	# enabled = yes
	# update every = 1
	# db dir = /tmp/netdata/var/cache/netdata/logs_management_db
There is also a separate logsmanagement.conf configuration file, which follows the standard .ini Netdata configuration format. It is read only once during initialiasation by the config_init() function and it works same as all the other user / stock configuration files that can be edited via the edit-config script.
Each section listed in the configuration file represents a different log source. The name of the section will be used as the chart name for that log source. Currently, 6 different log type configuration options are supported:
generic(default, tails log files using our own C implementation)flb_generic(same as above, but using Fluent-Bit engine and Fluent-Bit tail input plugin)web_log(tails and parses web log files using our own C implementation, based on the Go web log plugin)flb_web_log(similar functionality to above, but using Fluent-Bit engine and Fluent-Bit tail input plugin)flb_systemd(collects and extracts metrics from Systemd logs using Fluent-Bit engine and Fluent-Bit systemd input plugin)flb_docker_events(collects and extracts metrics from Docker event logs using Fluent-Bit engine and Fluent-Bit docker events input plugin)
Configuration options common to all log source types:
enabled: Whether this log source will be monitored or not.update every: How often to update the charts (netdata.confupdate everyhas priority over this)log type: Type of this log. If unset,genericwill be used by default.circular buffer max size: Maximum RAM used to buffer collected logs until they are inserted in the database.compression acceleration: Fine-tunes tradeoff between log compression speed and compression ratio, see here for more.buffer flush to DB: Interval at which logs will be transferred from in-memory buffers to the database.disk space limit: Maximum disk space that all compressed logs in database can occupy (per log source).
Configuration options applicable to WEB_LOG and FLB_WEB_LOG log types only:
log path: Absolute path of log file source.verify parsed logs: If enabled, the parser will attempt to verify some fields for correctness, when extracting metrics. For example, a Vhost not matching this regex:^[a-zA-Z0-9:.-]+will be measured as invalid in the respective chart if this setting is enable, otherwise it will show up as a valid entry.log format: Indicates the formatting of the logs. Supported options are currently Apache log formats and NGINX log formats. There is also the option for autodetection of the log format if the keywordautois used instead.vhosts chart,ports chart.... : Disable individual charts, all charts enabled by default.
Custom charts based on regex parsers
Any log source section of logsmanagement.conf can optionally have a practically unlimited number of custom charts added to it, in the form of:
	custom xxx chart = sudo
	custom xxx regex name = sudo
	custom xxx regex = \bsudo\b
	custom xxx ignore case = yes
where a dimension named as the value of custom xxx regex name will count the log records of this source that match the regex defined by custom xxx regex. xxx must be an incremental integer for any new regex to be monitored, starting from 1 for each log source.
If custom xxx regex name is absent, then the regex (i.e. the value of custom xxx regex) will be used as the dimension name instead.
If custom xxx chart exists already for this log source, then a new dimension will be added to it rather than a new chart being created, so this is a way for regexs to be grouped together in the same chart (see example below).
Configuration Examples
Example of configuration for the collection of Apache access logs:
[Apache access.log]
	enabled = yes
	update every = 1
	circular buffer max size = 256 # in MiB
	compression acceleration = 1 # see https://github.com/lz4/lz4/blob/90d68e37093d815e7ea06b0ee3c168cccffc84b8/lib/lz4.h#L195
	buffer flush to DB = 6 # in sec, default 6 min 4
	disk space limit = 500 # in MiB, default 500MiB
	log path = /var/log/apache2/access.log
	log format = %h %l %u %t "%r" %>s %b "%{Referer}i" "%{User-agent}i"
	verify parsed logs = yes
	# log format = auto
	vhosts chart = yes
	ports chart = yes
	IP versions chart = yes
	unique client IPs - current poll chart = yes
	unique client IPs - all-time chart = yes
	http request methods chart = yes
	http protocol versions chart = yes
	bandwidth chart = yes
	timings chart = yes
	response code families chart = yes
	response codes chart = yes
	response code types chart = yes
	SSL protocols chart = yes
	SSL chipher suites chart = yes
Example of configuration for the collection of NGINX access logs:
[Nginx access.log]
	enabled = yes
	update every = 1
	circular buffer max size = 256 # in MiB
	compression acceleration = 1 # see https://github.com/lz4/lz4/blob/90d68e37093d815e7ea06b0ee3c168cccffc84b8/lib/lz4.h#L195
	buffer flush to DB = 6 # in sec, default 6 min 4
	disk space limit = 500 # in MiB, default 500MiB
	log path = /var/log/nginx/access.log
	log format = $remote_addr - $remote_user [$time_local] "$request" $status $body_bytes_sent $request_length $request_time "$http_referer" "$http_user_agent"
	verify parsed logs = yes
	vhosts chart = yes
	ports chart = yes
	IP versions chart = yes
	unique client IPs - current poll chart = yes
	unique client IPs - all-time chart = yes
	http request methods chart = yes
	http protocol versions chart = yes
	bandwidth chart = yes
	timings chart = yes
	response code families chart = yes
	response codes chart = yes
	response code types chart = yes
	SSL protocols chart = yes
	SSL chipher suites chart = yes
Example of configuration for System Logs collection:
[System Logs]
	enabled = yes
	update every = 1
	log type = flb_systemd
	circular buffer max size = 256 # in MiB
	compression acceleration = 1 # see https://github.com/lz4/lz4/blob/90d68e37093d815e7ea06b0ee3c168cccffc84b8/lib/lz4.h#L195
	buffer flush to DB = 6 # in sec, default 6 min 4
	disk space limit = 500 # in MiB, default 500MiB
	priority value chart = yes
	severity chart = yes
	facility chart = yes
Example of configuration for Docker Events Logs collection:
[Docker Events Logs]
	enabled = yes
	update every = 1
	log type = flb_docker_events
	circular buffer max size = 256 # in MiB
	compression acceleration = 1 # see https://github.com/lz4/lz4/blob/90d68e37093d815e7ea06b0ee3c168cccffc84b8/lib/lz4.h#L195
	buffer flush to DB = 6 # in sec, default 6 min 4
	disk space limit = 500 # in MiB, default 500MiB
	event type chart = yes
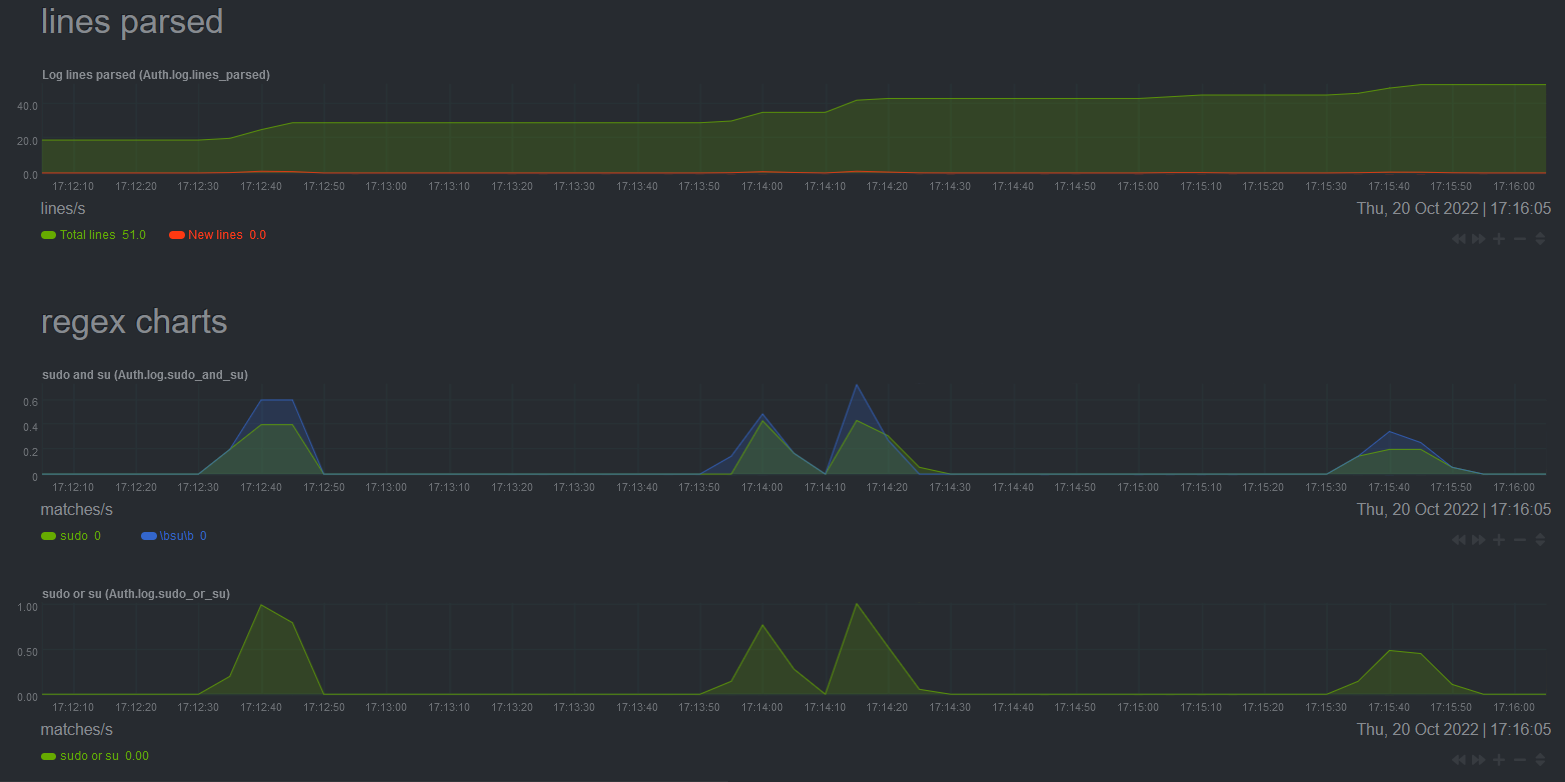
Example of configuration for a generic log source collection with custom regex-based parsers:
[Auth.log]
	enabled = yes
	update every = 5
	log type = generic
	circular buffer max size = 256 # in MiB
	compression acceleration = 1 # see https://github.com/lz4/lz4/blob/90d68e37093d815e7ea06b0ee3c168cccffc84b8/lib/lz4.h#L195
	buffer flush to DB = 6 # in sec, default 6 min 4
	disk space limit = 500 # in MiB, default 500MiB
	log path = /var/log/auth.log

	custom 1 chart = sudo and su
	custom 1 regex name = sudo
	custom 1 regex = \bsudo\b
	custom 1 ignore case = yes

	custom 2 chart = sudo and su
	# custom 2 regex name = su
	custom 2 regex = \bsu\b
	custom 2 ignore case = yes

	custom 3 chart = sudo or su
	custom 3 regex name = sudo or su
	custom 3 regex = \bsudo\b|\bsu\b
	custom 3 ignore case = yes
And the generated charts based on this configuration:
Log Collection
2 modules can be used for the collection of logs:
Tail_plugin.c
tail_plugin.c uses libuv's FS Event handle to monitor a given path for changes. FS Event handle uses a kernel interface such as inotify or kqueue to detect events. Once an event is detected (and provided the log file has grown in size), an asynchronous file read is scheduled to collect the new logs. The read_file_cb() callback function is then responsible for (synchronously) compressing* the collected logs, pushing them into the circular buffer and notifying the parser thread that they need to be parsed. All callbacks of this plugin run in the logs management main thread.
During all this, no other events from the same log source should be processed, so FS Event handle monitoring is disable for the particular log source and re-enabled once read_file_cb() finishes its work.
The plugin will handle log rotations using the create method (but not the copytrunctate method yet). Also, it will handle any "UV_ENOENT no such file or directory" errors in case any file becomes incaccessible for some reason and until it is accessible again.
Important! If a file log source is missing during initialisation, it will never be monitored without an agent restart, even if it becomes available later. That said, if it gets (re)moved later, it will still be monitored when it reppears.
*We want the compression to happen as soon as possible, so that the compressed logs are ready to be streamed.
FLB_plugin.c
flb_plugin.c uses the Fluent-Bit log processor to:
- Implement log file tailing in a similar way to tail_plugin.c and
- Collect and parse systemd logs and docker event logs.
Fluent-Bit has its own multi-threaded engine to collect, buffer, process and forward logs. All logs collected using flb_plugin.c need to pass through the Fluent-Bit engine first, which adds to the total memory and CPU consumption. However, the Fluent-Bit engine and its plugins are very robust and support features such as log rotation, multi-line logs etc. out-of-the-box.
A preliminary comparison and benchmarking between Fluent-Bit log tailing and Netdata log tailing (before Fluent-Bit was integrated into the agent) was done and can be found here. tail_plugin.c is significantly faster than flb_plugin.c (and even than the Go web log plugin as measured here), but not as complete in terms of functionality. So for now, both options are supported in the configuration file.
It is worth noting that while the Fluent-Bit tail plugin can deliver raw logs from files, the Fluent-Bit systemd and docker events plugins deliver only structured logs (by querying the respective daemon). This makes metrics extraction for system and docker event logs easier (no need to use the parser thread), however because we store all logs in the database in unstructured format**, any structured logs must be reconstructed. System logs are reconstructed in the RFC3164 Syslog format before they get compressed and docker event logs to the default presentation format used by the docker events command.
**Moving forward, we can pass on the choice of unstructured vs structured log storage to the user.
Buffering
The logs are temporarily stored in a circular buffer that consists of discrete items of struct Circ_buff_item type:
typedef struct Circ_buff_item {
    circ_buff_item_status_t status;    /**< Denotes if item is unprocessed, in processing or processed **/
    uint64_t timestamp;                /**< Epoch datetime of when data was collected **/
    char *data;                        /**< Base of buffer to store both uncompressed and compressed logs **/
    size_t text_size;                  /**< Size of uncompressed logs **/
    char *text_compressed;             /**< Pointer offset within *data that points to start of compressed logs **/
    size_t text_compressed_size;       /**< Size of compressed logs **/
    size_t data_max_size;              /**< Allocated size of *data **/
} Circ_buff_item_t;
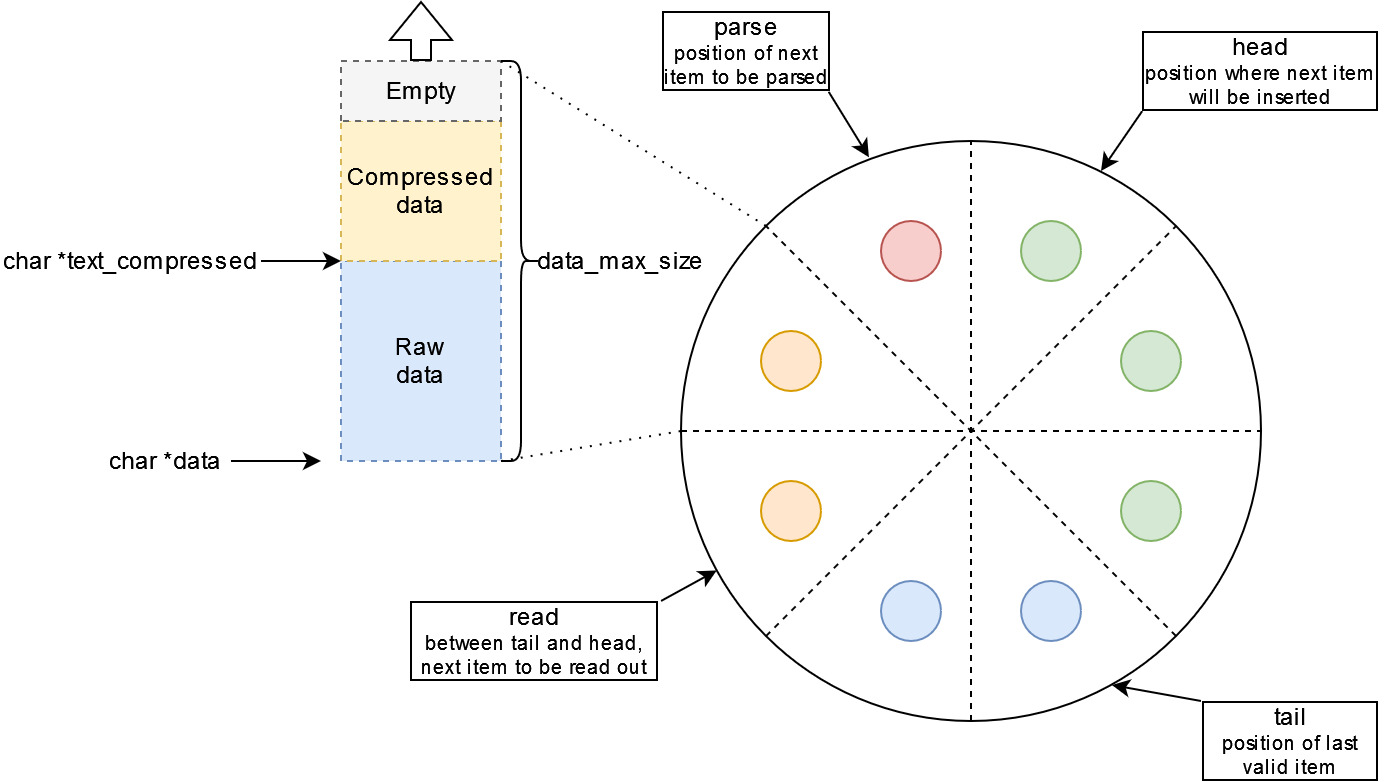
The char *data pointer of each Circ_buff_item_t item points to a continuous memory area, which stores first the raw logs and then (in series) the compressed logs collected in that iteration (see left-hand side of below image). When new raw and compressed logs are to be inserted in such a space of a Circ_buff_item_t item, char *data can be realloc'ed if more than size_t data_max_size is required (provided that the sum of all these buffers for each circular buffer is not > circular buffer max size, as that is defined in the configuration file).
There are four indices that are used with the circular buffer (head, parse, read and tail) and their use can be seen in the image below. For example, in this particular instance:
- items with a green circle are available to be reused,
- items with a blue circle inside cannot be reused yet, as they have been read by the "database writer" thread, but the synchronisation of the data and metadata to the disk and the database have not been completed yet,
- items with an orange circle are ready to be read (
status = CIRC_BUFF_ITEM_STATUS_DONE) and transferred to the database, - items with a red circle must still remain in the circular buffer, as they have not been fully processed yet (this could mean e.g. parsing is pending).
The total number of discrete Circ_buff_item_t items for each log source is equal to buffer flush to DB + CIRCULAR_BUFF_SPARE_ITEMS. The former is defined in the configuration file of each log source, while the latter is hard-coded to 2. This ensures that in the worst case scenario, the database writer is allowed to take up to 2 secs to flush the buffered items, without prohibiting any new logs to be collected.
This circular buffer implementation has some useful properties:
- Due to the use of (atomic) indices to keep track of
head,readandtailpositions, it is lockless. Items can be inserted, read or get parsed simultaneously. - No large copies occur when a new item is inserted, since pointer exchange is used.
- Raw and compressed log data are stacked up using the same base address (per item); this results in reduced memory usage.
Parsing
TODO
Database Storage
The default path for the logs management database is /var/cache/netdata/logs_management_db/ but it can be changed in netdata.conf. Under that path, a main.db SQLite database can be found. This database has 1 table (LogCollections) with 3 columns, which links each log source to its database path. For example, for a Systemd log source and an Apache access.log log source, the table could look like this:
| Id | Machine_GUID | Log_Source_Path | Type | DB_Dir |
|---|---|---|---|---|
| 1 | d9f57f3c-3aaf-11ed-b7b7-dd88b84aa470 | systemd_default | 2 | /tmp/netdata/var/cache/netdata/logs_management_db/da8e33a7-9ea9-4c9b-a75a-d6be14e718cc/ |
| 2 | d9f57f3c-3aaf-11ed-b7b7-dd88b84aa470 | /var/log/apache2/access.log | 1 | /tmp/netdata/var/cache/netdata/logs_management_db/6558ff1c-95f1-4d5a-8169-556e1c7cc7f8/ |
The Machine_GUID column is not used currently, but it will be useful in the future if streaming is added, to uniquely (globally) identify a log collection.
Now, if for example we examine the Systemd path, we will see a metadata.db SQLite database which stores metadata information about the collected Systemd logs and 10 BLOBs that store the compressed logs:
$ sudo ls -l /var/cache/netdata/logs_management_db/systemd_0
total 428
-rw-r----- 1 netdata netdata   5162 Aug 18 23:51 logs.bin.0
-rw-r----- 1 netdata netdata      0 Aug 18 23:41 logs.bin.1
-rw-r----- 1 netdata netdata      0 Aug 18 23:41 logs.bin.2
-rw-r----- 1 netdata netdata      0 Aug 18 23:41 logs.bin.3
-rw-r----- 1 netdata netdata      0 Aug 18 23:41 logs.bin.4
-rw-r----- 1 netdata netdata      0 Aug 18 23:41 logs.bin.5
-rw-r----- 1 netdata netdata      0 Aug 18 23:41 logs.bin.6
-rw-r----- 1 netdata netdata      0 Aug 18 23:41 logs.bin.7
-rw-r----- 1 netdata netdata      0 Aug 18 23:41 logs.bin.8
-rw-r----- 1 netdata netdata      0 Aug 18 23:41 logs.bin.9
-rw-r----- 1 netdata netdata   4096 Aug 18 23:41 metadata.db
-rw-r----- 1 netdata netdata  32768 Aug 18 23:51 metadata.db-shm
-rw-r----- 1 netdata netdata 391432 Aug 18 23:51 metadata.db-wal
metadata.db includes 2 tables, which in this example look like:
Blobs table:
| Id | Filename | Filesize |
|---|---|---|
| 1 | logs.bin.0 | 5162 |
| 2 | logs.bin.1 | 0 |
| 3 | logs.bin.2 | 0 |
| 4 | logs.bin.3 | 0 |
| 5 | logs.bin.4 | 0 |
| 6 | logs.bin.5 | 0 |
| 7 | logs.bin.6 | 0 |
| 8 | logs.bin.7 | 0 |
| 9 | logs.bin.8 | 0 |
| 10 | logs.bin.9 | 0 |
Logs table:
| Id | FK_BLOB_Id | BLOB_Offset | Timestamp | Msg_compr_size | Msg_decompr_size |
|---|---|---|---|---|---|
| 1 | 1 | 0 | 1660862500727 | 79 | 77 |
| 2 | 1 | 79 | 1660862550143 | 98 | 100 |
| 3 | 1 | 177 | 1660862552424 | 254 | 309 |
| 4 | 1 | 431 | 1660862561737 | 79 | 77 |
| 5 | 1 | 510 | 1660862622747 | 79 | 77 |
| 6 | 1 | 589 | 1660862683757 | 79 | 77 |
| 7 | 1 | 668 | 1660862701520 | 189 | 311 |
| 8 | 1 | 857 | 1660862718333 | 98 | 100 |
| ... | ... | ... | ... | ... | ... |
Every buffer flush to DB seconds, the circular buffer items with status = CIRC_BUFF_ITEM_STATUS_DONE will be saved to the database in the following steps:
- Retrieve next circular buffer item with
status = CIRC_BUFF_ITEM_STATUS_DONE. - Write compressed logs from that item in
logs.bin.0. - Write metadata of saved logs in
Logstable ofmetadata.db. - Update
Filesizeoflogs.bin.0inBlobstable ofmetadata.db. - Repeat until there are no more items that can be retrieved from circular buffer.
- (Synchronously) flush BLOBs data and SQLite metadata to disk.
- Check
disk space limitto see if BLOBs need to be rotated (logs.bin.0becomeslogs.bin.1and so on, untillogs.bin.9is truncated and becomeslogs.bin.0).
There is a database writer thread per log source.
Querying
2 new endpoints have been added to the web API. The first one retrieves all available log sources that are being monitored at that moment: /api/v1/logsmanagement_sources
For example, if it is systemd logs and Apache access.log that are being monitored, it would return on success:
{
	"version": 1,
	"log sources": {
		 "System Logs":{
			"basename": "systemd",
			"filename": "systemd",
			"log type": "FLB_SYSTEMD",
			"DB dir": "/tmp/netdata/var/cache/netdata/logs_management_db/systemd_0/",
			"DB flush interval": 6,
			"DB disk space limit": 524288000
		},
		 "Apache access.log":{
			"basename": "access.log",
			"filename": "/var/log/apache2/access.log",
			"log type": "WEB_LOG",
			"DB dir": "/tmp/netdata/var/cache/netdata/logs_management_db/access.log_1/",
			"DB flush interval": 6,
			"DB disk space limit": 524288000
		}
	},
	"error code": 0,
	"error": "no error"
}
The second endpoint can be used to query the logs management database (and the circular buffers) for logs that were generated and collected from a certain log source, within a specific timeframe. For example, to retrieve system logs, a request could look like this:
/api/v1/logsmanagement?from=1660933646475&until=1660933649201&chart_name=System Logs&ignore_case=1&keyword=dimitris
where the client:
- Must use the
fromanduntilparameters (in epoch milliseconds) to define a timeframe to be searched. - Must either use the
chart_nameor thefilenameparameter, to define the log source to be searched. Thechart_nametakes precedence in case both values are defined. - Can used a
quota(in bytes) that if surpassed, no more logs will be returned in this request. - Can optionally include a
keyword, so that only logs including the keyword will be returned. In that case,ignore_casecan also be used. The keyword can be provided either in plain text or as a POSIX regex. If there are any special characters to be searched, such as[]\^$.|?*+(){}, thensanitise_keywordmust also be set to 1, otherwise the special characters will not be escaped and they will be used by the POSIX regex engine.
The results of the above example request will look similar to this:
{
	"version": 1,
	"requested from": 1660933646475,
	"requested until": 1660933649201,
	"requested keyword": "dimitris"
	"actual from": 1660933646475,
	"actual until": 1660933649201,
	"quota": 524288,
	"requested filename": [

	],
	"requested chart_name": [
		"System Logs"
	]
	"data":[
		[ 1660933646475, "<85>Aug 19 19:27:26 WORK-PC-wsl sudo[unknown]: dimitris : TTY=pts/3 ; PWD=/home/dimitris ; USER=root ; COMMAND=/bin/bash\n<86>Aug 19 19:27:26 WORK-PC-wsl sudo[unknown]: pam_unix(sudo:session): session opened for user root by dimitris(uid=0)", 2],
		[ 1660933649201, "<85>Aug 19 19:27:29 WORK-PC-wsl sudo[unknown]: dimitris : TTY=pts/3 ; PWD=/home/dimitris ; USER=root ; COMMAND=/bin/bash\n<86>Aug 19 19:27:29 WORK-PC-wsl sudo[unknown]: pam_unix(sudo:session): session opened for user root by dimitris(uid=0)", 2]
	],
	"data array length": 524,
	"keyword matches": 4,
	"user time": 9876,
	"system time": 3364,
	"error code": 0,
	"error": "success"
}
If the quota*** is exceeded and there are more logs that match the query, the actual until value will be less than the requested until value. It is then the responsibility of the client to perform a new query to retrieve the remaining logs, where the new requested from value is the previous actual until value. This way a form of pagination is implemented and all the requests remain stateless.
***Note that due to the way the logs management collection engine works (i.e. logs are collected every 1 sec and compressed and stored as a single entry), each data array element may contain more than one log messages that have been collected under the same timestamp (and thus 1 sec is the minimum quantum of logs that can be queried and returned by a request).
Finally, the return error codes can be found here.
Test Plan
At the current project state, the recommended way to test it is to build it using the logsmanagement/stress_test/run_stress_tests.sh script:
Usage: run_stress_test.sh [ARGS]...
Example: run_stress_test.sh 0 1 2 1000 1000000 10 6 6 0
Build, install and run netdata with logs management
functionality enabled and (optional) stress tests.

arg[1]: [build_clean_netdata]                    Default: 0
arg[2]: [optimisation_level]                     Default: 1
arg[3]: [num_log_sources]                        Default: 0
arg[4]: [delay_between_msg_write]                Default: 1000000 us
arg[5]: [total_msgs_per_source]                  Default: 1000000
arg[6]: [queries_delay]                          Default: 3600 s
arg[7]: [log_rotate_after_sec]                   Default: 3600 s
arg[8]: [delay_open_to_write_sec]                Default: 6 s
arg[9]: [run_logs_management_tests_only]         Default: 0
with the following options for example, the script will make a clean agent build with debug symbols, and it will create 2 artificial web log sources which will start generating 1 log record / sec, after 6 seconds:
./run_stress_test.sh 1 0 2 1000000 1000000 3600 3600 6 0
Setting num_log_sources == 0 will disabled all stress tests. To test the project in its release state, run:
./run_stress_test.sh 1 1 0
The script installs Netdata as root in /tmp/netdata.
Unit Tests
There are very few unit tests written for the moment and only for functions that are mostly independent from the rest of the code (i.e. no "setup" stage exists for the unit tests). This is something that needs to be worked on more on a case-by-case basis as the project goes on.
Performance
Some benchmarking results can be found here and here. As far as the web logs case goes (since it's the only one that has been benchmarked), using the WEB_LOG option for log collection and parsing is faster than using the equivalent Go plugin. However, using FLB_WEB_LOG is at least 25% slower than using WEB_LOG (and potentially a lot more, as all benchmarking was performed before Fluent-Bit was integrated into the agent).
More benchmarking is required now that Fluent-Bit can be used by the agent to reach to conclusive results about performance.
External Dependencies / Packaging
The logs management code has been added to the agent's build system (there are 2 new flags, --enable-logsmanagement and --enable-logsmanagement-tests).
However, Fluent-Bit must also be built as a shared library and deployed together with Netdata (it is loaded at runtime using dlopen()). ~~For development, it has been being built using the run_stress_test.sh script and by passing on any necessary CFLAGS and LDFLAGS to ./netdata-installer.sh.~~
Update: Now Fluent-Bit configuration, compilation and installation is fully integrated with the Netdata installer.
~~Fluent-bit's plugins have been configured so that there are no other external dependencies, apart from libsystemd-dev (tested on Debian, Ubuntu, Fedora).~~ Update: Some dependencies have been introduced as Fluent-Bit doesn't build properly without flex, bison and on Alpine fts-dev. In the future, flex and bison might be removed from the dependencies list.
TODO
Some future items (in no particular order):
- ~~Integrate Fluent-Bit build into agent's build code~~
- Add streaming (and / or exporting) support
- ~~Add keyword matches to query results~~
- Add support for parsers other than CSV (such as LTSV, JSON)
- Add log tagging and aggregation of various log sources
- Add
copytrunctaterotation support to tail plugin - Add services to systemd logs chart
- Support RFC5424 system log format
- Support storage of logs in structured format (?)
- Complete compound queries (works for DB search, doesn't work for circular buffers)
- Add more monitoring charts for logs management (~~DB size~~, CPU usage, workers etc.)
- Add configuration options for number of DB BLOBs (currently hardcoded to 10).
- Support more log sources (~~and a generic log parser~~, related: https://github.com/netdata/netdata/issues/7420 https://github.com/netdata/netdata/pull/4900 https://github.com/netdata/netdata/issues/3729
- ~~plugin_logsmanagement.c, parser.c and parser.h could do with refactoring as the metrics and charts structs waste a lot of memory the way they are designed now.~~
- Handle metadata vacuuming / defragmentation.
- Add 2nd tier "cold" log storage / archiving, instead of just deletion of oldest records.
- Handle special case of full circular buffers.
- Consider adding non-disk (RAM-only) mode.
- Ensure update of all circular buffer indexes happens atomically (i.e. head, tail .... are updated simultaneously and not in series).
- ~~Add support for future database migrations.~~
Hey, @Dim-P. You need to rebase your PR. See all the conflicting files.
Yes, will do. It's not ready yet, just a draft.
The logs management code has been added to the agent's build system (there are 2 new flags, --enable-logsmanagement and --enable-logsmanagement-tests). However, Fluent-Bit must also be built as a shared library and deployed together with Netdata (it is loaded at runtime using dlopen()). For development, it has been being built using the run_stress_test.sh script and by passing on any necessary CFLAGS and LDFLAGS to ./netdata-installer.sh.
Hello @Dim-P ,
dlopen is not supported properly by musl compilers and as consequence we won't have it available for our kickstart script, did you already think some work around for this? Why are you not creating a static library like we do for libbpf?
Best regards!
When we compile this PR on Alpine 3.16 that has muslcompiler as default we got this error:
 --- Cleanup compilation directory ---
[/home/thiago/Netdata/netdata]# make clean
 OK  ''

 --- Compile netdata ---
[/home/thiago/Netdata/netdata]# make -j1
libnetdata/log/log.c:7:10: fatal error: execinfo.h: No such file or directory
    7 | #include <execinfo.h>
      |          ^~~~~~~~~~~~
compilation terminated.
make[2]: *** [Makefile:6261: libnetdata/log/log.o] Error 1
make[1]: *** [Makefile:7491: all-recursive] Error 1
make: *** [Makefile:3813: all] Error 2
 FAILED  ''
CI is not running on this PR, probably this is the motive you did not detect these issues with musl and static binaries.
I will proceed review on Slackware current where I can compile, because I can compile with GCC.
Well, I discovered that I should pass --enable-logsmanagement :man_facepalming: and after this I got different issues, please, take a look on them. I will only review code for while. :handshake:
I am sorry, I saw that I did not initialize properly a module, but after to initialize it, it was not possible to compile netdata
err.txt .
PR description is very detailed, but should we add user facing documentation?
PR description is very detailed, but should we add user facing documentation?
If you mean a README.md then yes, but I was waiting for feedback on the high-level functionality of the PR before I was going to go ahead and add end-user docs. If we think there won't be any massive changes, I can proceed with that.
Thank you very much @Dim-P you had a hard work here. The suggestions and adjusts are minor considering the size of the code. I will return for your PR when we have condition to compile it everywhere. :handshake: I have some ideas to test it, but I need to compile it on different operate systems to test its behavior.
Hello @Dim-P ,
Please, rebase your PR to fix the current issue.
I finally could compile your PR on Alpine 3.16 and I observed the following warns:
logsmanagement/db_api.c: In function 'db_init':
logsmanagement/db_api.c:719:31: warning: unused variable 'total_logs_filesize' [-Wunused-variable]
  719 |                 const int64_t total_logs_filesize = (int64_t) sqlite3_column_int64(stmt_retrieve_total_logs_size, 0);
      |                               ^~~~~~~~~~~~~~~~~~~
In file included from logsmanagement/../libnetdata/libnetdata.h:433,
                 from logsmanagement/helper.h:10,
                 from logsmanagement/parser.c:11:
logsmanagement/parser.c: In function 'search_keyword':
logsmanagement/parser.c:288:29: warning: format '%d' expects argument of type 'int', but argument 6 has type 'regoff_t' {aka 'long int'} [-Wformat=]
  288 |         debug(D_LOGS_MANAG, "Match %d [%2d-%2d]:%.*s\n", matches, groupArray[0].rm_so,
      |                             ^~~~~~~~~~~~~~~~~~~~~~~~~~~           ~~~~~~~~~~~~~~~~~~~
      |                                                                                |
      |                                                                                regoff_t {aka long int}
logsmanagement/../libnetdata/log/log.h:95:114: note: in definition of macro 'debug'
   95 | #define debug(type, args...) do { if(unlikely(debug_flags & type)) debug_int(__FILE__, __FUNCTION__, __LINE__, ##args); } while(0)
      |                                                                                                                  ^~~~
logsmanagement/parser.c:288:42: note: format string is defined here
  288 |         debug(D_LOGS_MANAG, "Match %d [%2d-%2d]:%.*s\n", matches, groupArray[0].rm_so,
      |                                        ~~^
      |                                          |
      |                                          int
      |                                        %2ld
In file included from logsmanagement/../libnetdata/libnetdata.h:433,
                 from logsmanagement/helper.h:10,
                 from logsmanagement/parser.c:11:
logsmanagement/parser.c:288:29: warning: format '%d' expects argument of type 'int', but argument 7 has type 'regoff_t' {aka 'long int'} [-Wformat=]
  288 |         debug(D_LOGS_MANAG, "Match %d [%2d-%2d]:%.*s\n", matches, groupArray[0].rm_so,
      |                             ^~~~~~~~~~~~~~~~~~~~~~~~~~~
  289 |                 groupArray[0].rm_eo, (int) match_len, cursor + groupArray[0].rm_so);
      |                 ~~~~~~~~~~~~~~~~~~~
      |                              |
      |                              regoff_t {aka long int}
logsmanagement/../libnetdata/log/log.h:95:114: note: in definition of macro 'debug'
   95 | #define debug(type, args...) do { if(unlikely(debug_flags & type)) debug_int(__FILE__, __FUNCTION__, __LINE__, ##args); } while(0)
      |                                                                                                                  ^~~~
logsmanagement/parser.c:288:46: note: format string is defined here
  288 |         debug(D_LOGS_MANAG, "Match %d [%2d-%2d]:%.*s\n", matches, groupArray[0].rm_so,
      |                                            ~~^
      |                                              |
      |                                              int
      |                                            %2ld
logsmanagement/parser.c:258:39: warning: unused parameter 'src_sz' [-Wunused-parameter]
  258 | int search_keyword( char *src, size_t src_sz,
      |                                ~~~~~~~^~~~~~
logsmanagement/query_test.c: In function 'test_execute_query_thread':
logsmanagement/query_test.c:100:58: warning: passing argument 3 of 'uv_fs_open' from incompatible pointer type [-Wincompatible-pointer-types]
  100 |     rc = uv_fs_open(&thread_loop, &open_req, query_params.filename, O_RDONLY, 0, NULL);
      |                                              ~~~~~~~~~~~~^~~~~~~~~
      |                                                          |
      |                                                          char **
In file included from logsmanagement/../libnetdata/libnetdata.h:100,
                 from logsmanagement/query.h:12,
                 from logsmanagement/query_test.c:7:
/usr/include/uv.h:1357:38: note: expected 'const char *' but argument is of type 'char **'
 1357 |                          const char* path,
      |                          ~~~~~~~~~~~~^~~~
In file included from logsmanagement/../libnetdata/libnetdata.h:433,
                 from logsmanagement/query.h:12,
                 from logsmanagement/query_test.c:7:
logsmanagement/query_test.c:140:29: warning: format '%s' expects argument of type 'char *', but argument 6 has type 'char **' [-Wformat=]
  140 |         debug(D_LOGS_MANAG, "Query file offset %" PRId64 " for %s\n", file_offset, query_params.filename);
      |                             ^~~~~~~~~~~~~~~~~~~~~                                  ~~~~~~~~~~~~~~~~~~~~~
      |                                                                                                |
      |                                                                                                char **
logsmanagement/../libnetdata/log/log.h:95:114: note: in definition of macro 'debug'
   95 | #define debug(type, args...) do { if(unlikely(debug_flags & type)) debug_int(__FILE__, __FUNCTION__, __LINE__, ##args); } while(0)
      |                                                                                                                  ^~~~
logsmanagement/query_test.c:122:14: warning: 'file_handle' may be used uninitialized in this function [-Wmaybe-uninitialized]
  122 |         rc = uv_fs_read(&thread_loop, &read_req, file_handle, &uv_buf, 1, file_offset, NULL);
      |              ^~~~~~~~~~~~~~~~~~~~~~~~~~~~~~~~~~~~~~~~~~~~~~~~~~~~~~~~~~~~~~~~~~~~~~~~~~~~~~~
logsmanagement/flb_plugin.c: In function 'flb_write_to_buff_cb':
logsmanagement/flb_plugin.c:365:32: warning: unused variable 'available_text_space' [-Wunused-variable]
  365 |                         size_t available_text_space = circ_buffer_prepare_write(buff, new_tmp_text_size);
      |                                ^~~~~~~~~~~~~~~~~~~~
logsmanagement/flb_plugin.c:621:22: warning: unused variable 'available_text_space' [-Wunused-variable]
  621 |         const size_t available_text_space = circ_buffer_prepare_write(buff, new_tmp_text_size);
      |                      ^~~~~~~~~~~~~~~~~~~~
logsmanagement/flb_plugin.c:766:22: warning: unused variable 'available_text_space' [-Wunused-variable]
  766 |         const size_t available_text_space = circ_buffer_prepare_write(buff, new_tmp_text_size);
      |                      ^~~~~~~~~~~~~~~~~~~~
Hello @Dim-P ,
We also have some warnings on Arm32 as you can see in this file.
Best regards!
The Alpine warnings should be mostly safe to ignore (for now) because they have to do with debugging, testing or variables used only in assert cases. But I will fix them.
As far as the arm 32-bit warnings go, can you please tell me what options you build with, as I cannot see them on my RPi?
As far as the arm 32-bit warnings go, can you please tell me what options you build with, as I cannot see them on my RPi?
Of course, I used the following cflags and options:
CFLAGS="-Og -ggdb -Wall -Wextra -fno-omit-frame-pointer -Wformat-signedness -fstack-protector-all -Wformat-truncation=2 -Wunused-result -DNETDATA_INTERNAL_CHECKS=1 -D_FORTIFY_SOURCE=2 -DNETDATA_VERIFY_LOCKS=1" ./netdata-installer.sh --disable-lto --dont-wait --dont-start-it --enable-logsmanagement
@Dim-P and @Ferroin ,
I tried to compile this PR on FreeBSD 13.1-RELEASE-p5 and I got these errors:
9 warnings generated.
warning: unknown warning option '-Wno-maybe-uninitialized'; did you mean '-Wno-uninitialized'? [-Wunknown-warning-option]
1 warning generated.
logsmanagement/parser.c:1306:68: warning: address of array 'line_parsed->vhost' will always evaluate to 'true' [-Wpointer-bool-conversion]
    if((parser_config->chart_config & CHART_VHOST) && line_parsed->vhost && *line_parsed->vhost){
                                                   ~~ ~~~~~~~~~~~~~^~~~~
logsmanagement/parser.c:1350:23: warning: address of array 'line_parsed->req_client' will always evaluate to 'true' [-Wpointer-bool-conversion]
         line_parsed->req_client && *line_parsed->req_client) {
         ~~~~~~~~~~~~~^~~~~~~~~~
logsmanagement/parser.c:1549:73: warning: address of array 'line_parsed->ssl_cipher' will always evaluate to 'true' [-Wpointer-bool-conversion]
    if((parser_config->chart_config & CHART_SSL_CIPHER) && line_parsed->ssl_cipher && *line_parsed->ssl_cipher){
                                                        ~~ ~~~~~~~~~~~~~^~~~~~~~~~
3 warnings generated.
logsmanagement/query.c:89:64: warning: address of array 'p_query_params->chart_name' will always evaluate to 'true' [-Wpointer-bool-conversion]
                (!p_query_params->filename && !p_query_params->chart_name))){
                                              ~~~~~~~~~~~~~~~~~^~~~~~~~~~
./config.h:501:41: note: expanded from macro 'unlikely'
#define unlikely(x) __builtin_expect(!!(x), 0)
                                        ^
logsmanagement/query.c:89:35: warning: address of array 'p_query_params->filename' will always evaluate to 'true' [-Wpointer-bool-conversion]
                (!p_query_params->filename && !p_query_params->chart_name))){
                 ~~~~~~~~~~~~~~~~~^~~~~~~~
./config.h:501:41: note: expanded from macro 'unlikely'
#define unlikely(x) __builtin_expect(!!(x), 0)
                                        ^
2 warnings generated.
logsmanagement/query_test.c:100:46: warning: incompatible pointer types passing 'char *[10]' to parameter of type 'const char *' [-Wincompatible-pointer-types]
    rc = uv_fs_open(&thread_loop, &open_req, query_params.filename, O_RDONLY, 0, NULL);
                                             ^~~~~~~~~~~~~~~~~~~~~
/usr/local/include/uv.h:1357:38: note: passing argument to parameter 'path' here
                         const char* path,
                                     ^
1 warning generated.
In file included from logsmanagement/flb_plugin.c:14:
In file included from logsmanagement/../fluent-bit/include/fluent-bit/flb_macros.h:23:
/home/thiago/Netdata/netdata/fluent-bit/lib/monkey/include/monkey/mk_core.h:33:10: fatal error: 'mk_core/mk_core_info.h' file not found
#include "mk_core/mk_core_info.h"
         ^~~~~~~~~~~~~~~~~~~~~~~~
1 error generated.
gmake[2]: *** [Makefile:6264: logsmanagement/flb_plugin.o] Error 1
gmake[2]: *** Waiting for unfinished jobs....
gmake[1]: *** [Makefile:7489: all-recursive] Error 1
gmake: *** [Makefile:3816: all] Error 2
 FAILED  ''
Before to install I ran ./packaging/installer/install-required-packages.sh --dont-wait and I also updated the submodules.
To compile I used the following command:
# ./netdata-installer.sh --dont-wait --dont-start-it --enable-logsmanagement 2> err >out
@Dim-P on my environment I cannot start netdata setting the following configuration inside netdata.conf:
[logs management]
	enabled = yes
when I tried this I got this SIGABRT:
Thread 36 "LOGSMANAGEMENT" received signal SIGABRT, Aborted.
[Switching to Thread 0x7fffe3f9b6c0 (LWP 8571)]
0x00007ffff7096d4b in pthread_kill@@GLIBC_2.34 () from /lib64/libc.so.6
(gdb) bt
#0  0x00007ffff7096d4b in pthread_kill@@GLIBC_2.34 () from /lib64/libc.so.6
#1  0x00007ffff7043602 in raise () from /lib64/libc.so.6
#2  0x00007ffff702b464 in abort () from /lib64/libc.so.6
#3  0x00007ffff708a4d8 in __libc_message () from /lib64/libc.so.6
#4  0x00007ffff70a03ca in malloc_printerr () from /lib64/libc.so.6
#5  0x00007ffff70a224c in _int_free () from /lib64/libc.so.6
#6  0x00007ffff70a4a3f in free () from /lib64/libc.so.6
#7  0x00000000004451f8 in freez_int (ptr=0x5f0c720, file=file@entry=0x9bed18 "logsmanagement/logsmanagement.c", function=function@entry=0x9bf3c0 <__FUNCTION__.0> "p_file_info_destroy", line=line@entry=57) at libnetdata/libnetdata.c:380
#8  0x000000000067c007 in p_file_info_destroy (p_file_info=p_file_info@entry=0x608d650) at logsmanagement/logsmanagement.c:57
#9  0x000000000067c415 in logs_management_init (config_section=config_section@entry=0x5f0c050) at logsmanagement/logsmanagement.c:212
#10 0x000000000067da8f in logsmanagement_main (ptr=0x25864c8) at logsmanagement/logsmanagement.c:636
#11 0x0000000000455103 in thread_start (ptr=<optimized out>) at libnetdata/threads/threads.c:203
#12 0x00007ffff7094fea in start_thread () from /lib64/libc.so.6
#13 0x00007ffff711f9ec in clone3 () from /lib64/libc.so.6
@thiagoftsm Thanks for the reports. I haven't tested it on FreeBSD and Slackware yet, I am going to have a look at it today.
Hello @Dim-P ,
During compilation time I observed different wanings. I used the following CFLAGS to compile:
CFLAGS="-Og -ggdb -Wall -Wextra -fno-omit-frame-pointer -Wformat-signedness -fstack-protector-all -Wformat-truncation=2 -Wunused-result -DHAVE_BACKTRACE=1 -DNETDATA_TRACE_ALLOCATIONS=1 -DNETDATA_DEV_MODE=1 -DNETDATA_INTERNAL_CHECKS=1 -D_FORTIFY_SOURCE=2 -DNETDATA_VERIFY_LOCKS=1"
Hello @Dim-P ,
I finally could run on Slackware current your PR using default configuration, and I have observed this:
2022-12-11 13:52:27: netdata INFO  : LOGSMANAGEMENT : (0521@logsmanagement/logsm:logs_management): [System Logs]: circular buffer max size = 67108864
2022-12-11 13:52:27: netdata INFO  : LOGSMANAGEMENT : (0526@logsmanagement/logsm:logs_management): [System Logs]: circular buffer drop logs if full = 0
2022-12-11 13:52:27: netdata ERROR : LOGSMANAGEMENT : (0552@logsmanagement/logsm:logs_management): [System Logs]: flb_add_input() error: -3 (errno 2, No such file or directory)

...


2022-12-11 13:52:27: netdata INFO  : LOGSMANAGEMENT : (0192@logsmanagement/logsm:logs_management): [Apache access.log]: log type = FLB_WEB_LOG
2022-12-11 13:52:27: netdata ERROR : LOGSMANAGEMENT : (0214@logsmanagement/logsm:logs_management): [Apache access.log]: log path = /var/log/apache2/access.log (errno 2, No such file or directory)
2022-12-11 13:52:27: netdata INFO  : LOGSMANAGEMENT : (0056@logsmanagement/logsm:p_file_info_des): [Apache access.log]: p_file_info_destroy() cleanup

...

2022-12-11 13:52:27: netdata INFO  : LOGSMANAGEMENT : (0159@logsmanagement/logsm:logs_management): [Auth.log]: Initializing config loading
2022-12-11 13:52:27: netdata INFO  : LOGSMANAGEMENT : (0170@logsmanagement/logsm:logs_management): [Auth.log]: enabled = yes
2022-12-11 13:52:27: netdata INFO  : LOGSMANAGEMENT : (0192@logsmanagement/logsm:logs_management): [Auth.log]: log type = FLB_GENERIC
2022-12-11 13:52:27: netdata ERROR : LOGSMANAGEMENT : (0214@logsmanagement/logsm:logs_management): [Auth.log]: log path = /var/log/auth.log (errno 2, No such file or directory)
You were expecting in default configuration a file that is present in Debian directories. When we compile Apache with default options the Apache Log Dir is /var/log/httpd/.
Another doubt, why are we not trying to parse files like /var/log/messages and /var/log/syslog? Unless I am missing something, these are default on all Linux (ping @Ferroin ).
@Dim-P ,
After successful compilation on FreeBSD I observed that I cannot start netdata, because I am receiving this error:
2022-12-11 15:41:09: netdata FATAL : LOGSMANAGEMENT : Could not compile regular expression:.*\bsu\b.*\bFAILED SU\b.*, error: trailing backslash (\) # : No error: 0

2022-12-11 15:41:09: netdata INFO  : LOGSMANAGEMENT : /usr/libexec/netdata/plugins.d/anonymous-statistics.sh 'FATAL' 'netdata:LOGSMANAGEMENT' '0490@logsmanage:logs_management/0'
We should not shutdown the whole netdata when logs fail, instead, we should stop only log thread.
On the other hand, when I compile your PR without --enable-logsmanagement I can start netdata without issues.
@Dim-P ,
I started netdata on Linux with the following logsmanagement.conf:
[Messages Logs]
        enabled = yes
        update every = 1
        log path = /var/log/messages

[Netdata Error Logs]
        enabled = yes
        update every = 1
        log path = /var/log/netdata/error.log
And I am observing these charts:
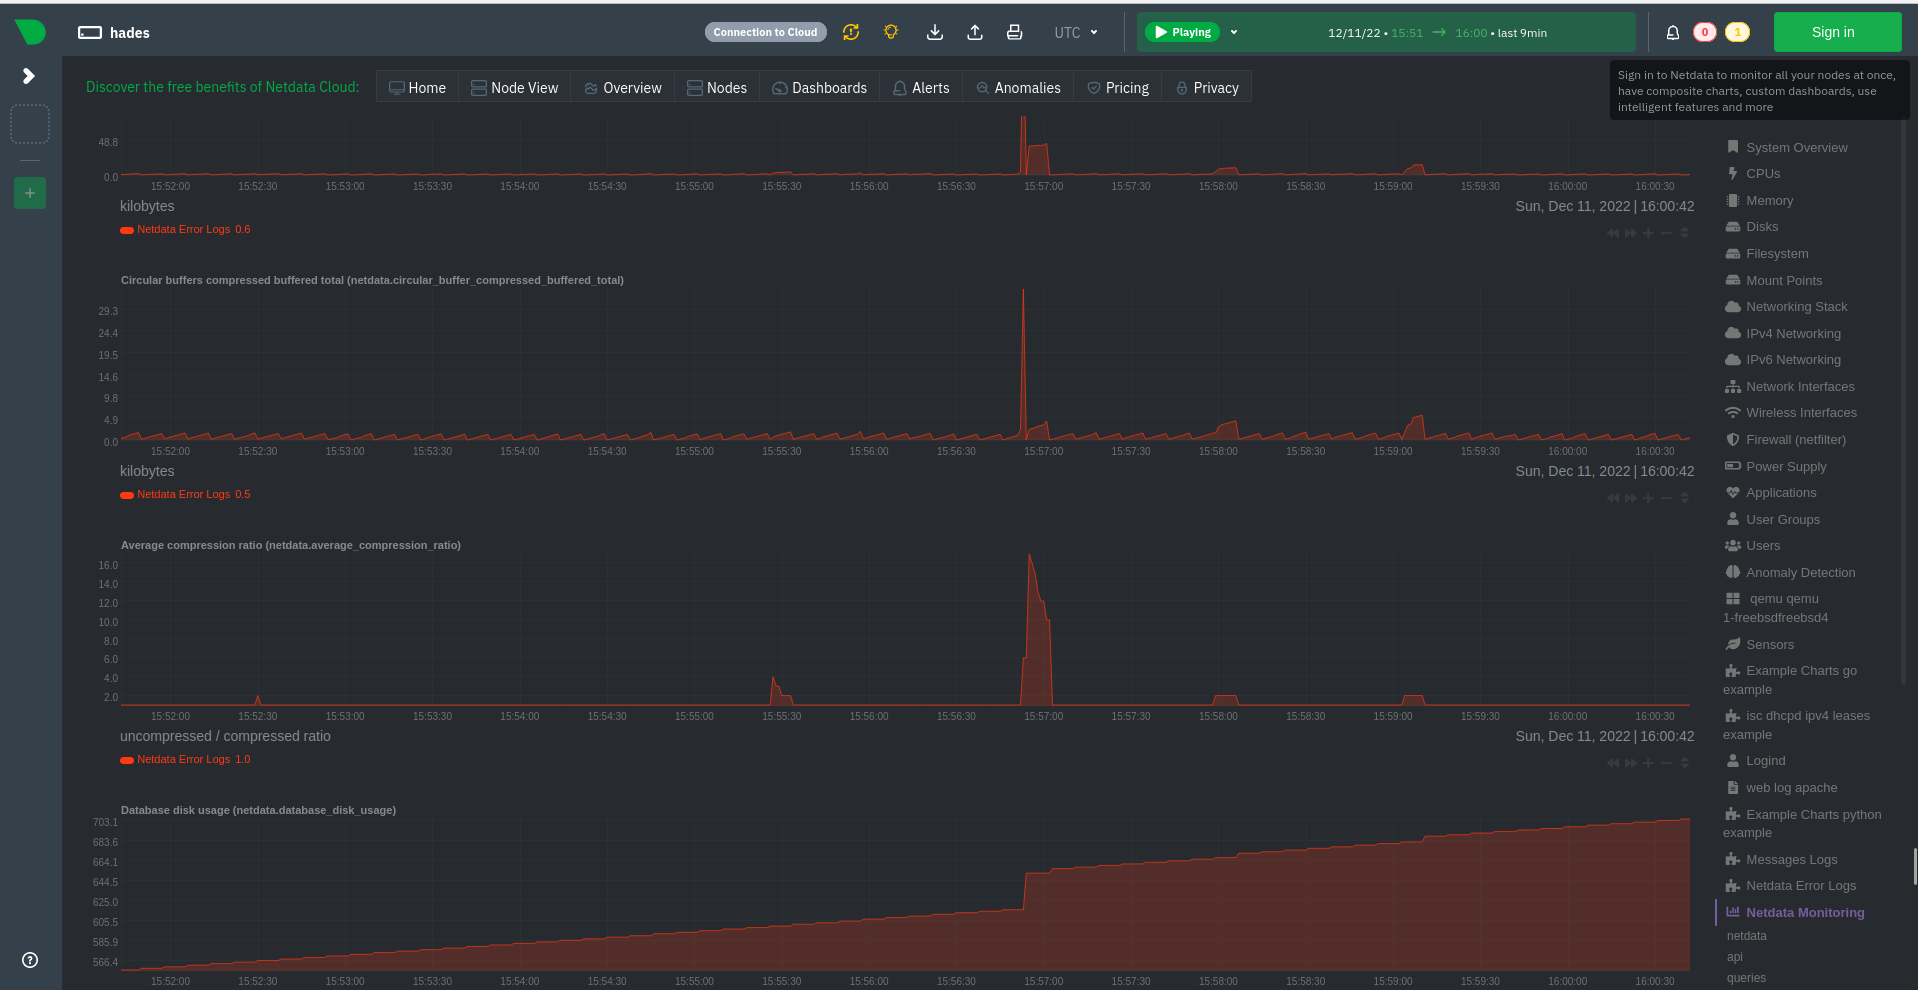
Considering dimension name, we should have a dimension per chart or we need to rename dimension.
Best regards!
Now a tip, I strongly suggest we parse our error.log and access.log by default. I observed we are not listing them when I used edit-config, and probably these are logs that we will always have.
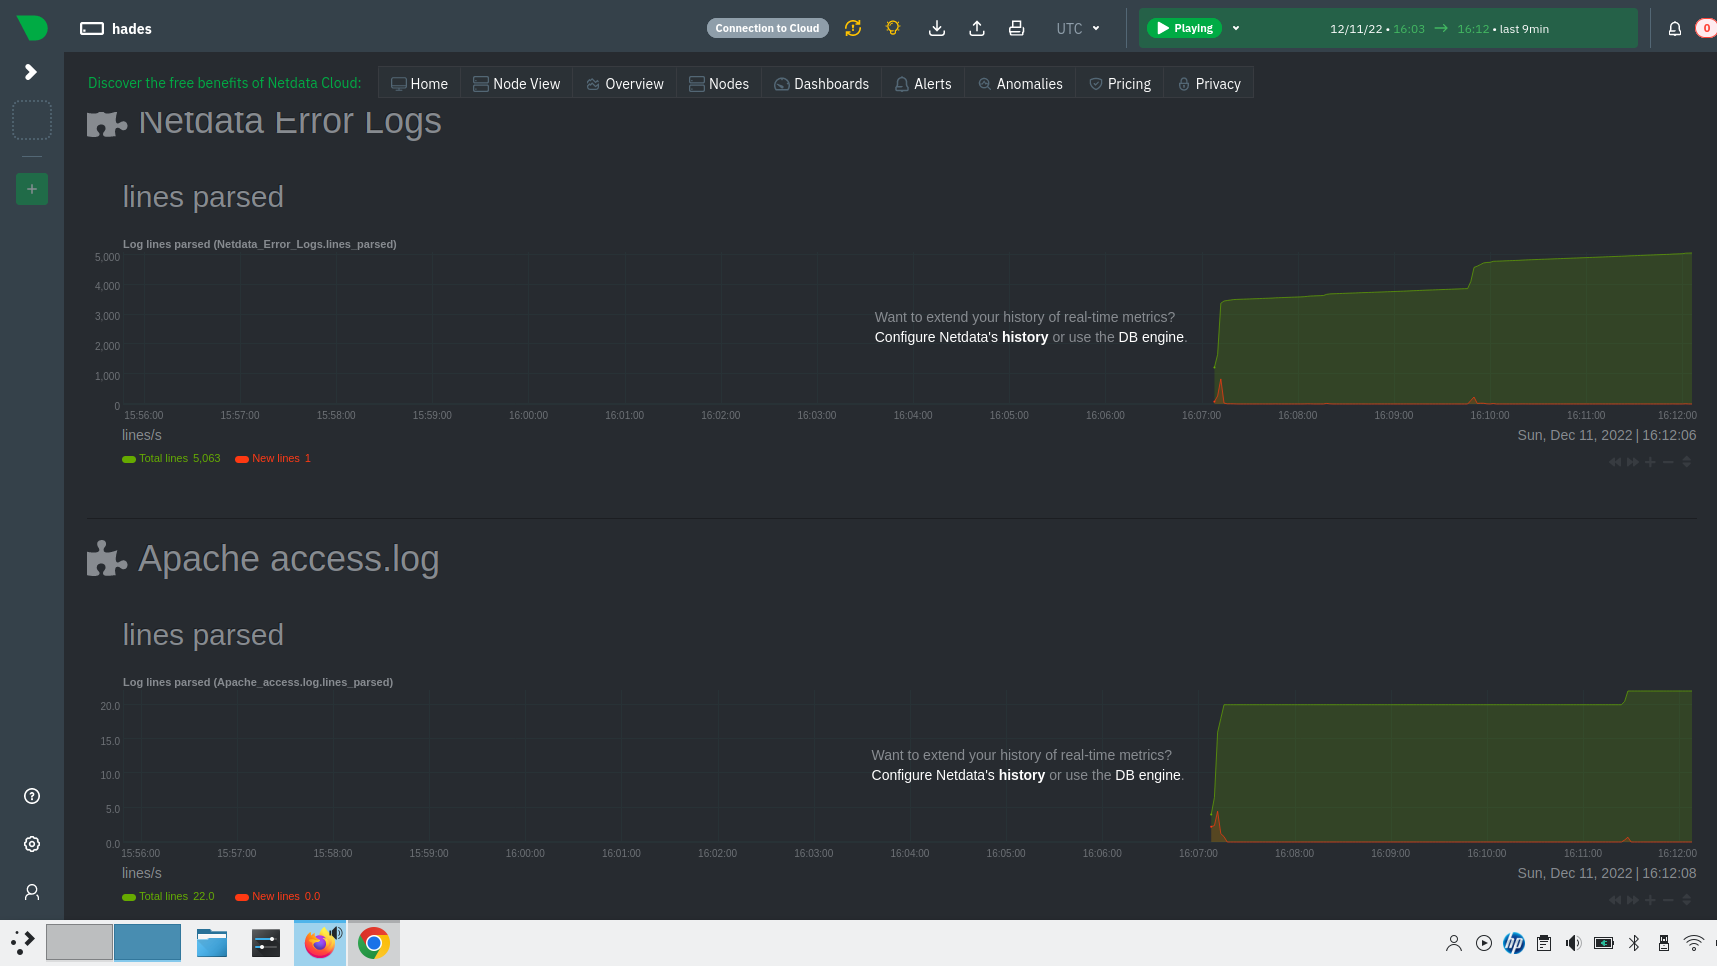
Well, I am finishing a round of tests with good news. I know I again required changes on PR, but on the other hand it is the first time I could run your PR with success on my environment, so congratulations @Dim-P!!! We are having huge improvements since my last tests. :partying_face:
Hi @thiagoftsm , thanks for testing the PR again! I did fix several FreeBSD issues, so yes, it should build now. Bear in mind that according to Fluent-Bit's platform support:
Fluent Bit can work also on OSX and *BSD systems, but not all plugins will be available on all platforms. Official support will be expanding based on community demand. Fluent Bit may run on older operating systems though will need to be built from source, or use custom packages from enterprise providers.
You were expecting in default configuration a file that is present in Debian directories. When we compile Apache with default options the Apache Log Dir is /var/log/httpd/.
Yes, that's correct. I think I will add a log path = auto option to try and look for the correct Apache directory, when the chart name is Appache access.log, without requiring the user to set it manually.
@Dim-P ,
I started
netdataon Linux with the followinglogsmanagement.conf:[Messages Logs] enabled = yes update every = 1 log path = /var/log/messages [Netdata Error Logs] enabled = yes update every = 1 log path = /var/log/netdata/error.logAnd I am observing these charts:
Considering dimension name, we should have a dimension per chart or we need to rename dimension.
Best regards!
This works correctly for me. I can see you have Messages Logs on the right-hand side of the dashboard, is it maybe that no logs were collected from that log source since you restarted Netdata? IIRC the dimensions will appear only if there are logs collected for a log source.
@Dim-P ,
After successful compilation on FreeBSD I observed that I cannot start
netdata, because I am receiving this error:2022-12-11 15:41:09: netdata FATAL : LOGSMANAGEMENT : Could not compile regular expression:.*\bsu\b.*\bFAILED SU\b.*, error: trailing backslash (\) # : No error: 0 2022-12-11 15:41:09: netdata INFO : LOGSMANAGEMENT : /usr/libexec/netdata/plugins.d/anonymous-statistics.sh 'FATAL' 'netdata:LOGSMANAGEMENT' '0490@logsmanage:logs_management/0'We should not
shutdownthe wholenetdatawhenlogsfail, instead, we should stop onlylogthread.On the other hand, when I compile your PR without
--enable-logsmanagementI can startnetdatawithout issues.
This is due to the way FreeBSD handles backslashes in POSIX regular expressions special characters (I believe they need to be escaped). Providing the user is aware of it (for example through the documentation), I think that's fine. You are right though in that just the logs management should fail, not the entire agent.
Now a tip, I strongly suggest we parse our
error.logandaccess.logby default. I observed we are not listing them when I usededit-config, and probably these are logs that we will always have.
You are right, I plan to add them to the list and parse them.
Hello @Dim-P ,
I can run your PR on FreeBSD now, but I still receive these errors:
2022-12-11 15:51:26: netdata FATAL : LOGSMANAGEMENT : Could not compile regular expression:.*\bsu\b.*\bFAILED SU\b.*, error: trailing backslash (\) # : No error: 0
2022-12-11 15:51:26: netdata INFO  : LOGSMANAGEMENT : /usr/libexec/netdata/plugins.d/anonymous-statistics.sh 'FATAL' 'netdata:LOGSMANAGEMENT' '0490@logsmanage:logs_management/0'
so we do not have the thread working on BSD.
Best regards!
Hello @Dim-P ,
On Slackware current I still have these warnings when I compile your PR.
I also notice that some places of the code we are using sprintf, instead sprintfz, please, modify this.
I will proceed with tests now. :handshake:
Best regards!
While I was testing I identified the following minor issues:
After days without to test this PR, while it was loading the database it reported:
2022-12-26 13:21:34: netdata FATAL : LOGSMANAGEMENT : (0075@logsmanagement/db_ap:fatal_sqlite3_e): [Netdata Error Logs]: SQLite error: database is locked (line 244) # : Success
Probably we are not closing it correctly, please, take a look on this.
Now about the charts, please, take a look on Apache logs:
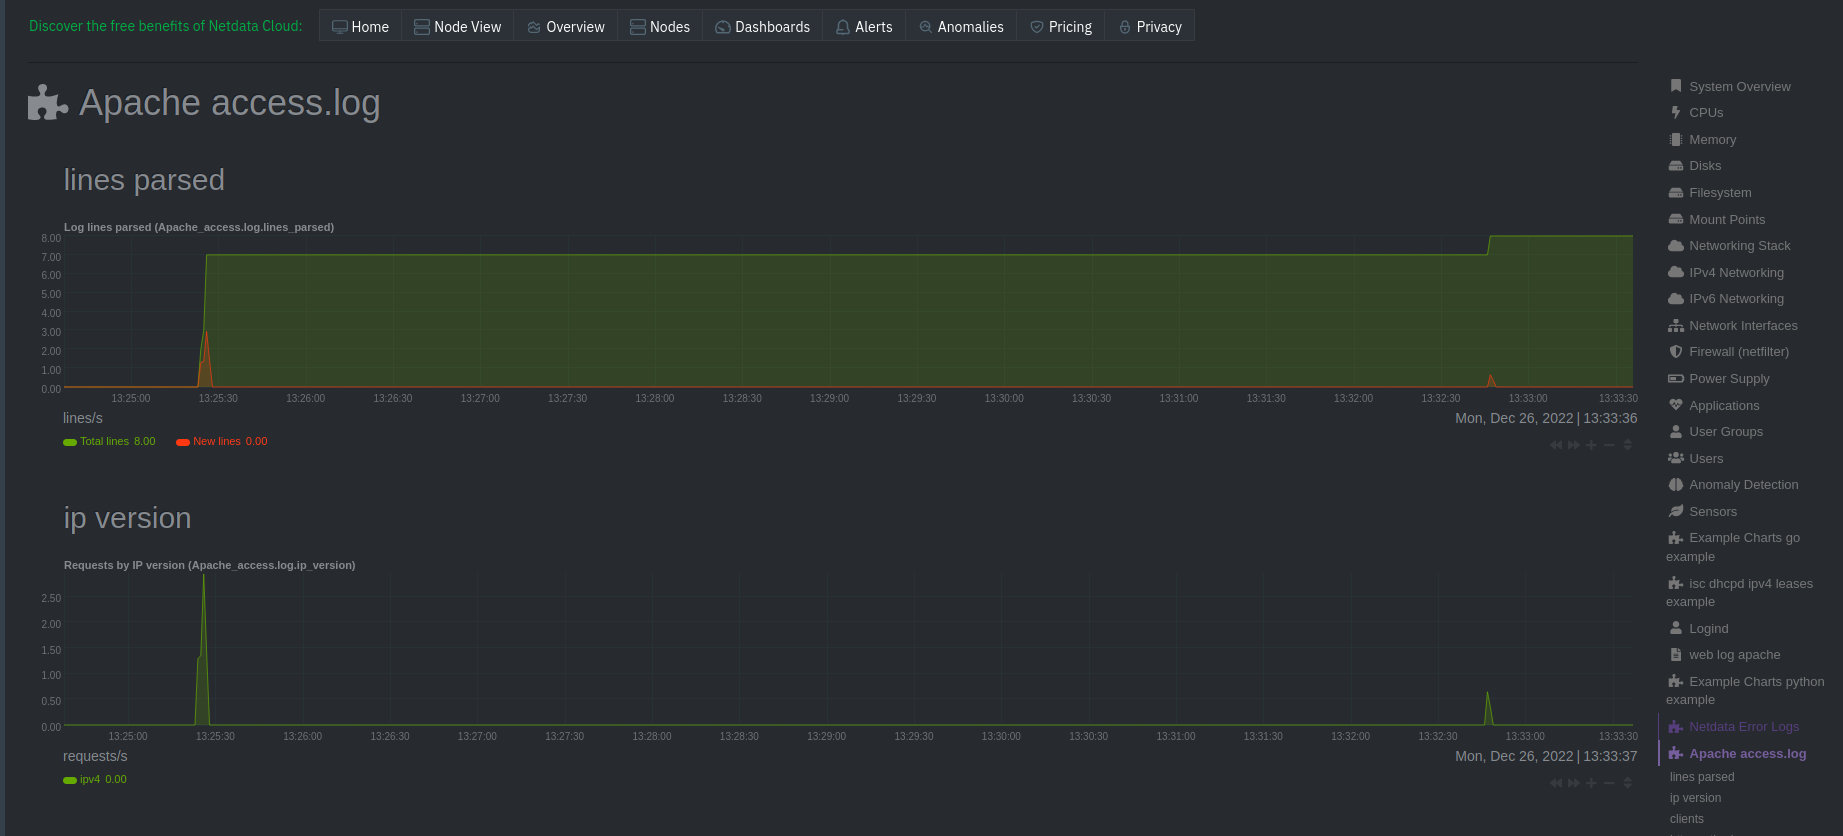
As you can see the dimensions are shown different for first chart, I suggest to use the same pattern.