Styling Regions
Hi All,
I'm trying to recreate a chart like below but running into some issues. Its basically two sets of on/off data that i need to show on the same chart.
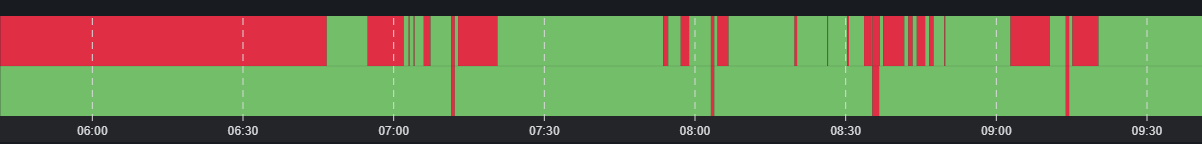
The way i'm going about it at the minute is a timeseries chart with two lines. The first set of data have on/off values of 0.9/0 and the second set has on/off values of 2/1.1. I can plot these on the chart alright but creating the regions is giving trouble. I've created one overall region in green and then created the on/off regions and added them to the chart.
I can do it alright for any one set of data but I need help trying to separate the two sets of red regions into a top and bottom half if anyone has any ideas? What i've tried is applying position:absolute to the bb-regions class and then setting position relative and top:0/bottom:0 to try and position the regions.
Thanks for any suggestions
I got this sorted with setting a style of height:50% to the top region and letting the bottom region run the full height as the bottom half off will always coincide with the top half being off but not vice versa. The last issue is is it possible to put tooltips on regions rather than the data points?
Hi @tconlon03, I'm trying to do something similar. How did you set the style height:50%? On the region's css class? Thanks