growthchart
 growthchart copied to clipboard
Published
8 years ago
•
 nathanleiby
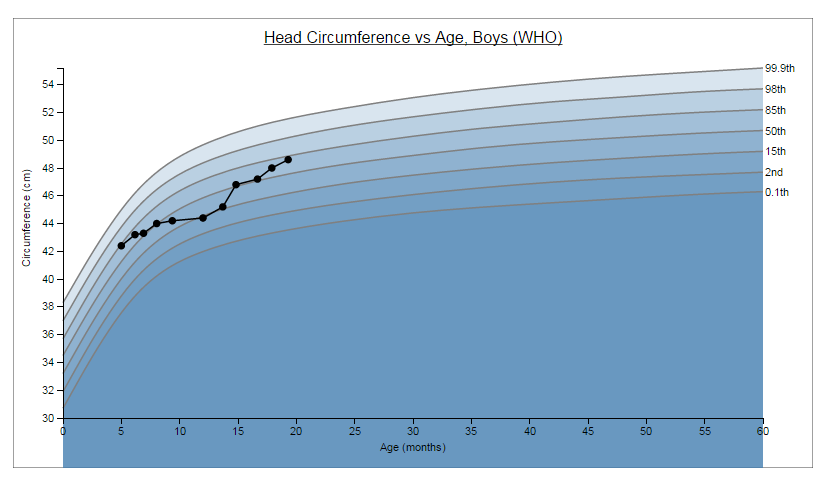
A visual tool used by doctors to monitor a child's nutrition and health.
growthchart
A visual tool used by doctors to monitor a child's nutrition and health.
Demo:
Screenshot:
Ideas:
- Work for weight vs age, height vs age, height vs weight, etc etc
- Work against various standards (CDC, WHO, national goverments)
Todos:
- Clarify which chart is which. (and if dataset is for boys and/or girls)
- Smoothly change between charts (How to dynamically add data to a chart)
- Default is to select the last datum; highlight it and show tooltip
- Improved tickmarks
- Labels on the lines, or a legend (%tile, malnourished/severely/normal); color for different lines
- Improve tooltip style... 1, 2, 3
Additions:
- Added metas and values for Head Circumference vs Age 0-5yrs for girls/boys based on WHO standards.
- Added metas and values for Length vs Age 0-5yrs for girls/boys based on WHO Standards.
- Added checks to change Y axis label based on new chart types
- Added checks to change tooltip text based on new chart types
Other Growth charts:
- OpenMRS Growth Chart module
- CDC, CDC Pdf
- page 138, table 9 (weight vs age, birth to 36 months)
- page 143, table 14 (weight vs age, 2 to 20 years)
- Online MedCalc
- UK Growth Charts
Thank you:
- to @ewheeler and the PyGrowup project for sharing the method to pre-process the WHO/CDC measurement data into json format.
Metadata
21
Stars
12
Forks
21
Watchers
Owner
Metadata
A visual tool used by doctors to monitor a child's nutrition and health.