seaborn
 seaborn copied to clipboard
[Feature request] [boxplot] Option to have boxplot widths according to the number of observations
Hi,
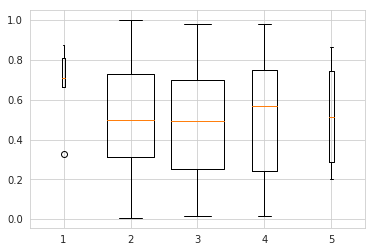
What I would really like as a feature in Seaborn's boxplot function, is the option to set the boxplot's widths according to the size of the dataset visualized in each box. This can be done pretty easily in matplotlib.pyplot with the boxplot widths argument:
import numpy as np
import pandas as pd
import matplotlib.pyplot as plt
import seaborn as sns

# Create five datasets with different numbers of sample sizes
sample_sizes = [5, 84, 95, 45, 10]
data = [np.random.ranf(s) for s in sample_sizes]

# Define widths for boxplots as 0.8 of the normalized sample size
widths = [0.8 * s / max(sample_sizes) for s in sample_sizes]

plt.boxplot(data, widths=widths)
plt.show()
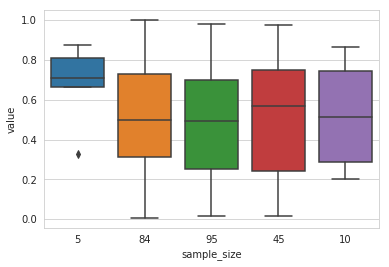
 However, then I'm loosing the awesome
 data=..., x=…, y=…, hue=… functionality and the nice styling that Seaborn provides:
# Function to make flat list out of list of lists
flatten = lambda l: [item for sublist in l for item in sublist]

# Construct DataFrame for seaborn boxplot
data_df = pd.DataFrame([flatten([[s] * s for s in sample_sizes]), flatten(data)]).T
data_df.rename(columns={0: 'sample_size', 1: 'value'}, inplace=True)

sns.boxplot(data=data_df, x='sample_size', y='value', order=sample_sizes)
plt.show()
I have tried to pass widths as a keyword argument in sns.boxplot, but then an error is returned saying the argument widths received multiple values. So it would be really cool to be able to pass the widths argument to pyplot, or even cooler if there was an argument in sns.boxplot that automatically sets the widths according to the respective sizes if it is set to True.
Thanks a lot!
Because this Issue and the linked PR (#1962) are pending I would like to ask if I can access the drawn boxes as a workaround.
Something like this:
box = sns.catplot(kind='box', data=dfs.Stammdaten, x='Sex', y='Age', hue='Group')
ax = box.axes[0][0]
ax.box[0].set_width(.5)
ax.box[1].set_width(.9)
Yes, it would be nice if the widht could be related to the sample size of the observation... Also I am grouping by "sample" and then by day... and I'am looking for a way to add a line to show the evolution of the median or mean... superimposition of a lineplot or a pointplot fails when a sample has only one day in it for some reason...
It's now (as of #3255) possible to pass per-box widths in boxplot, although it's somewhat limited and doesn't work when using hue:
widths = tips["day"].value_counts(normalize=True)
widths /= widths.max() * 1.25
sns.boxplot(data=tips, x="day", y="total_bill", order=widths.index, widths=widths)

Closing as this is now at least partially supported, and supporting the general/full case (i.e. working well with hue and dodged plots) would be complicated. It's possible it will be added at some point in the future but I've no specific plans.
Any chance this could be reopend?
in some way or another conveying the number of samples per box(en)plots would be really beneficial for statistical purposes.
Boxplot would need to be entirely rewritten. Not sure why it generates so differently than all other viz. I spent months trying to solve for this.
my solution was some custom functions that altered the viz after it was constructed. very annoying.
Why you may ask? because I REALLY wanted it to work with this: https://github.com/dhaitz/mplcyberpunk