Michael Waskom
Michael Waskom
With a line plot, you're encoding data by position, whereas with a fill/area plot you're encoding it by size/area. You can encode arbitrary data by position, but (strictly speaking) the...
With the [`Area`](https://seaborn.pydata.org/generated/seaborn.objects.Area.html) mark added to the new [objects interface](https://seaborn.pydata.org/tutorial/objects_interface.html), I'm going to close this as complete. It's not impossible that something like `areaplot` would get added to the plotting...
Hm, yes, good question. When `despine` and `FacetGrid` were written, spine visibility was not something you could configure through matplotlib rcparams so this wasn't so much of an issue. Note...
> With regards changing {side}=False to mean "do not modify visibility", would this not affect anyone who doesn't change from matplotlib's default style? I don't think so. The parameter *defaults*...
I kinda feel like we should decouple "removal" and "visibility" and rewrite the code that way, so that the ticks only get moved to the opposite side if their spine...
It's possible that something like this would get added in the future, but it is not something that could be added right now. Track #2429 for updates. In general I...
You could plot a cumulative KDE and then invert the y axis 🤔
Or this is probably a better workaround ```python x = np.random.randn(100) ax = sns.kdeplot(x, cumulative=True) ax.lines[-1].set_ydata(1 - ax.lines[-1].get_ydata()) ``` 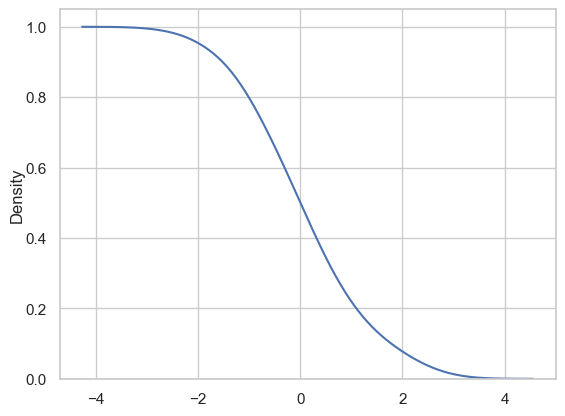
I think it would be helpful to know a little bit more about the usecase for this. What advantages does it have over a "normal" cumulative KDE? What questions would...
Sorry, I understand what a survival function is in the context of statistical testing, but what is the circumstance in which you'd gain something from plotting it? In a hypothesis...