Should profile include time (seconds) per-frame?
e.g. in this profile https://profiler.firefox.com/public/7cq70hq3nhz6dnnzcvb8yw5c0409xn2y8xxjbt0/flame-graph/?globalTrackOrder=0&hiddenLocalTracksByPid=21272-01&profileName=dot%20%28after%29&symbolServer=http%3A%2F%2F127.0.0.1%3A3000%2F2cbhn8l3jjvx3sc28f7x2yz8qgnkxgx5r008d9w&thread=0&v=8
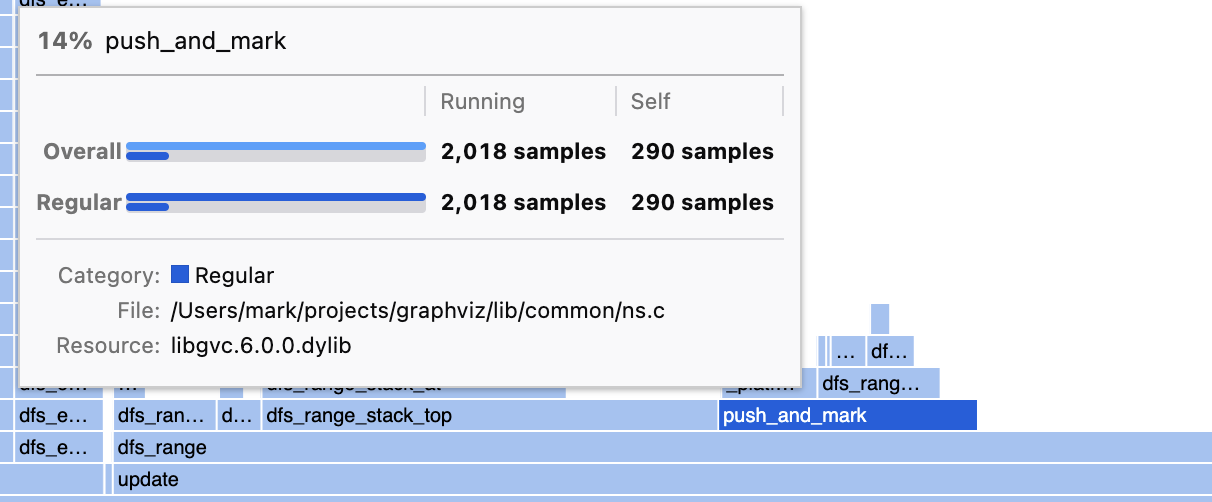
I see 14%, 2018 samples. But it doesn't map that to time (whether CPU time or wall time).
I understand sometimes it's tricky to communicate the difference of CPU-time vs wall-time. But perhaps we could show one? This can help communicate the profiles to an audience that's less familiar with profiling (they'll understand 'seconds' better than 'samples').
I'd probably expect to see, with a sampling profile taken at 100Hz, that each sample should be weighted at about 10ms, so you can add it up and see the total time in the Firefox Profiler UI?
We've gone back and forth on this. Originally we had milliseconds everywhere, computed via sample count times interval. Then we decided it was too misleading and switched to sample counts everywhere. We had lots of profiles where the sampler thread was starved and there were large gaps between samples, so if a function that took 50ms of CPU time only got 2 samples, it showed up as 2ms, and we decided that just displaying "2 samples" in that case was closer to the truth. First and foremost, a profiler should not lie. By the way, you can see the profiling interval in the Profile Info popup.
I'd like to transfer this issue to https://github.com/firefox-devtools/profiler/issues/ but github can't transfer issues between organizations; could you file it again there?