Memory never released after sttWithMetadata (Python)
- Have I written custom code (as opposed to running examples on an unmodified clone of the repository): My code is pretty much vanilla AF. Just want to run STT with metadata, nothing fancy.
- OS Platform and Distribution: Arch Linux (Latest)
- Python version: 3.8
- CUDA/cuDNN version: CUDA [10.1] / CUDNN [7.6]
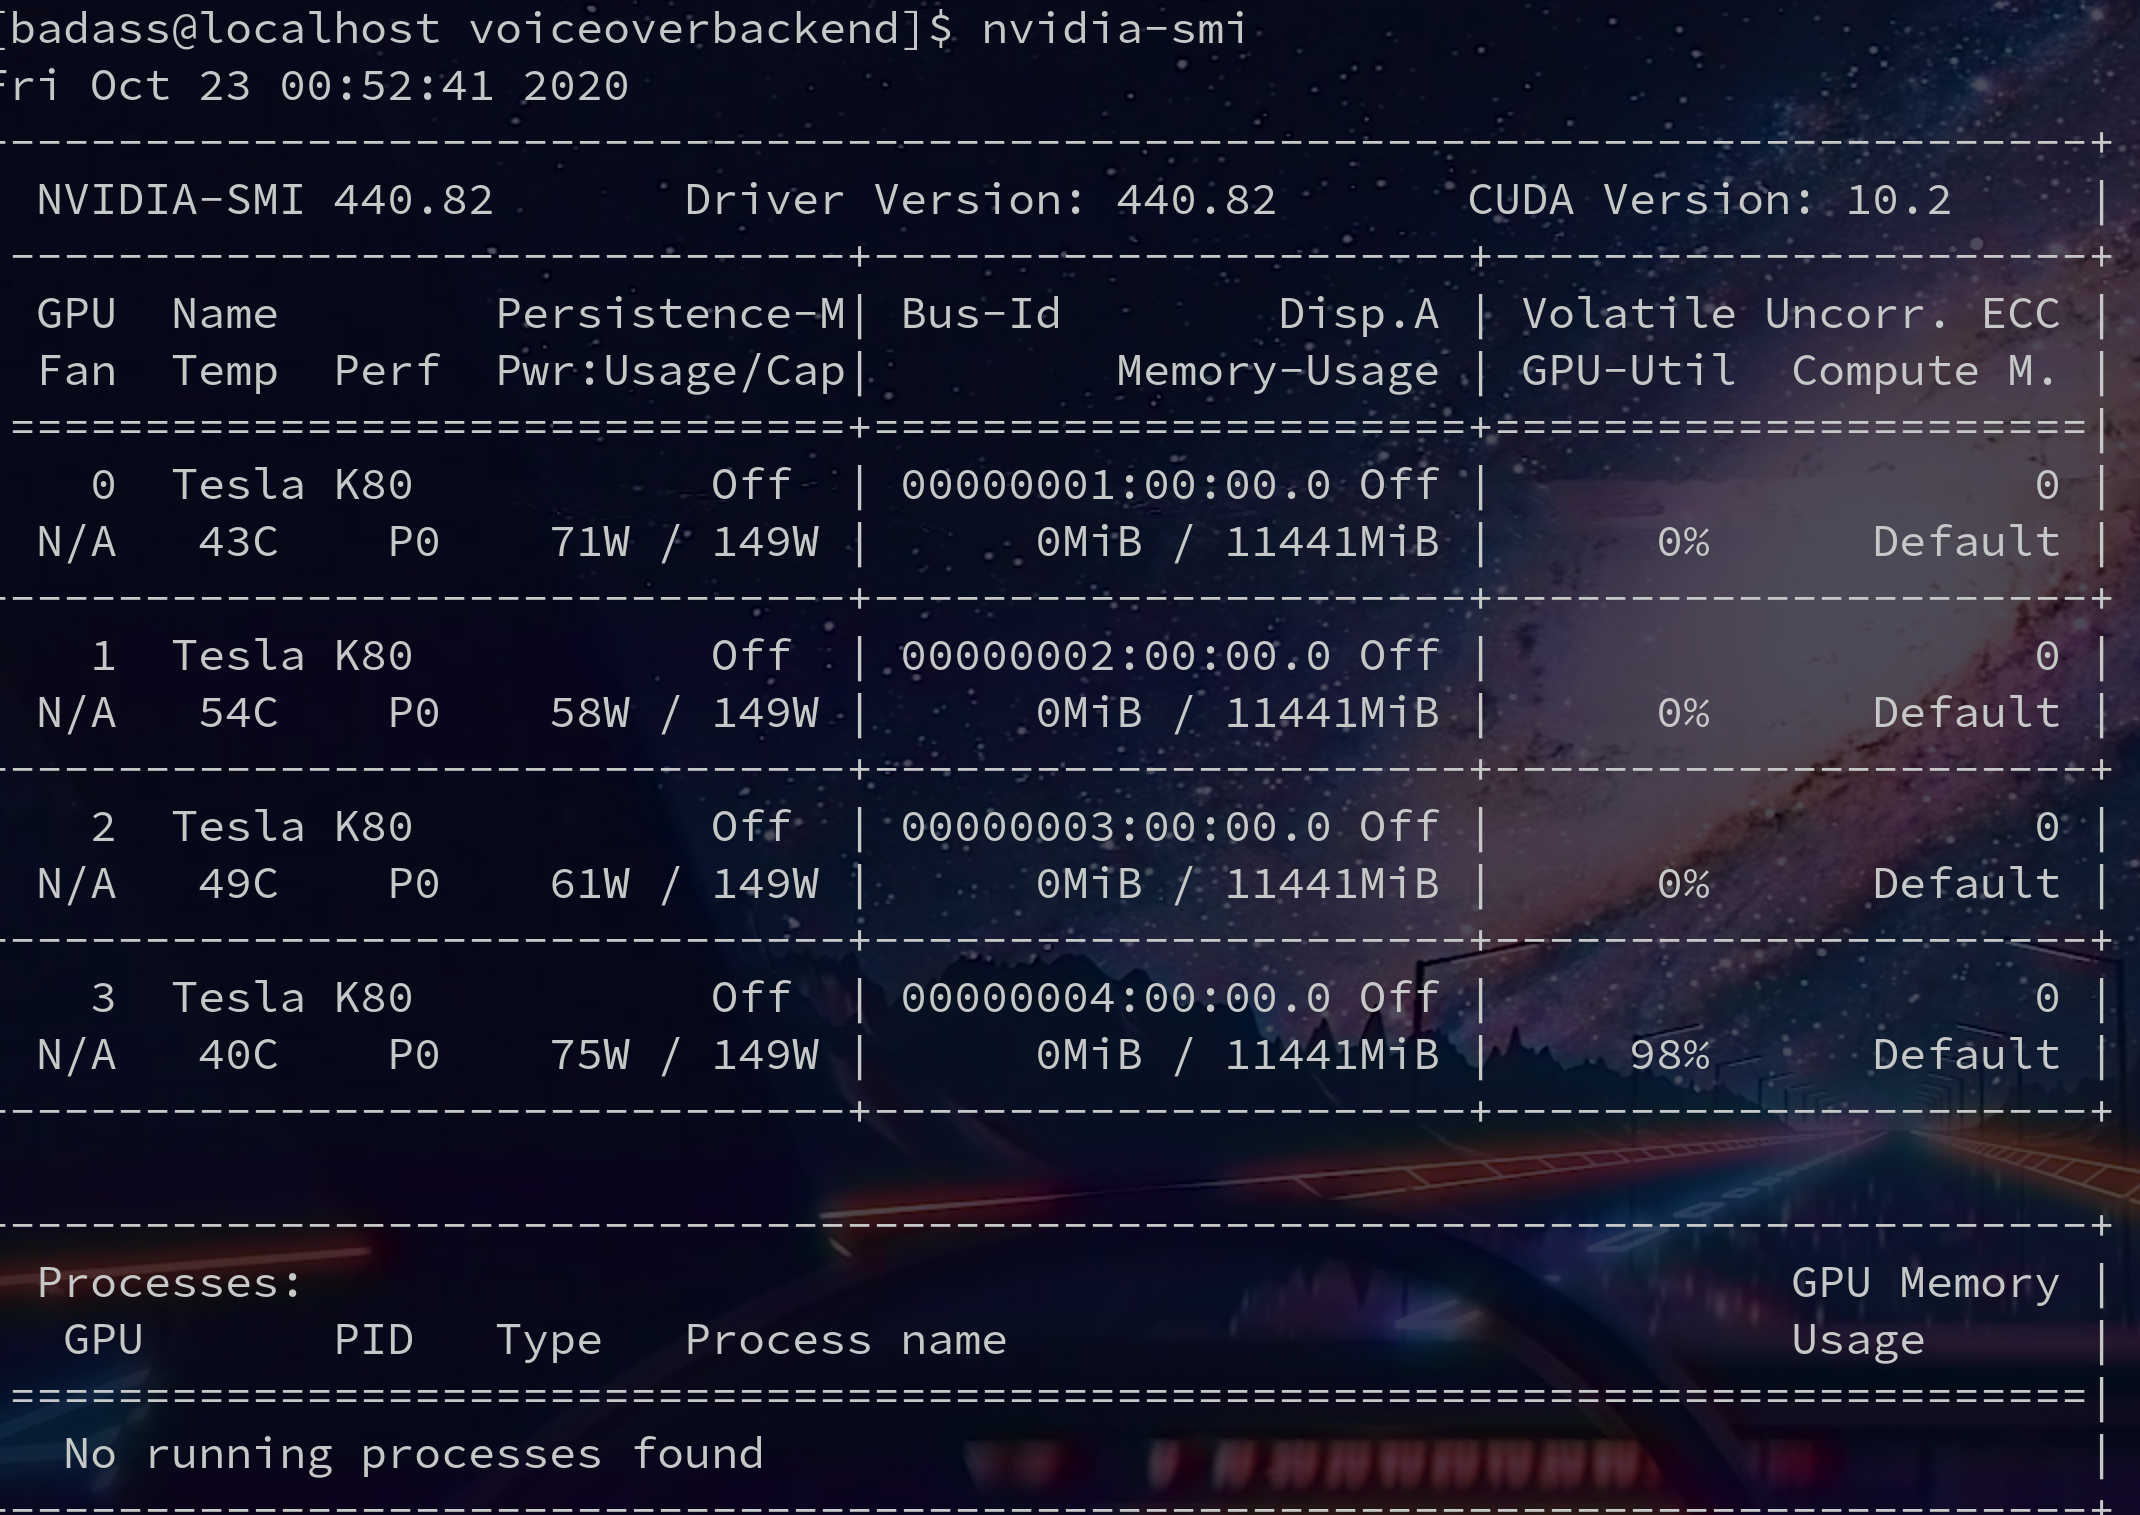
- GPU model and memory: 4x Tesla K80 (11441MiB memory each) You can obtain the TensorFlow version with
bash
python -c "import tensorflow as tf; print(tf.GIT_VERSION, tf.VERSION)"
- TensorFlow installed from (our builds, or upstream TensorFlow): [2.2.0-24] or atleast that's what the logs say. The command above returns that I don't have TF installed, but I'm assuming nothing would work without TF so is it bundled when I install the deepspeech-gpu through pip somehow?
Please describe the problem clearly. Be sure to convey here why it's a bug or a feature request.
GPU memory is never released after executing sttWithMetadata()
Exact command to reproduce:
Anyone should be able to reproduce by running sttWithMetadata() from the deepspeech-gpu python lib. This is the code I'm using:
    def generate_words(array, model, scorer):
        # Initialize DeepSpeech
        model = deepspeech.Model(model)
        model.enableExternalScorer(scorer)

        # Run DeepSpeech NN-model
        metadata = model.sttWithMetadata(array)

        # Process MetaData => Words
        transcript = metadata.transcripts[0]
        words = dstools.words_from_candidate_transcript(transcript)
        return words
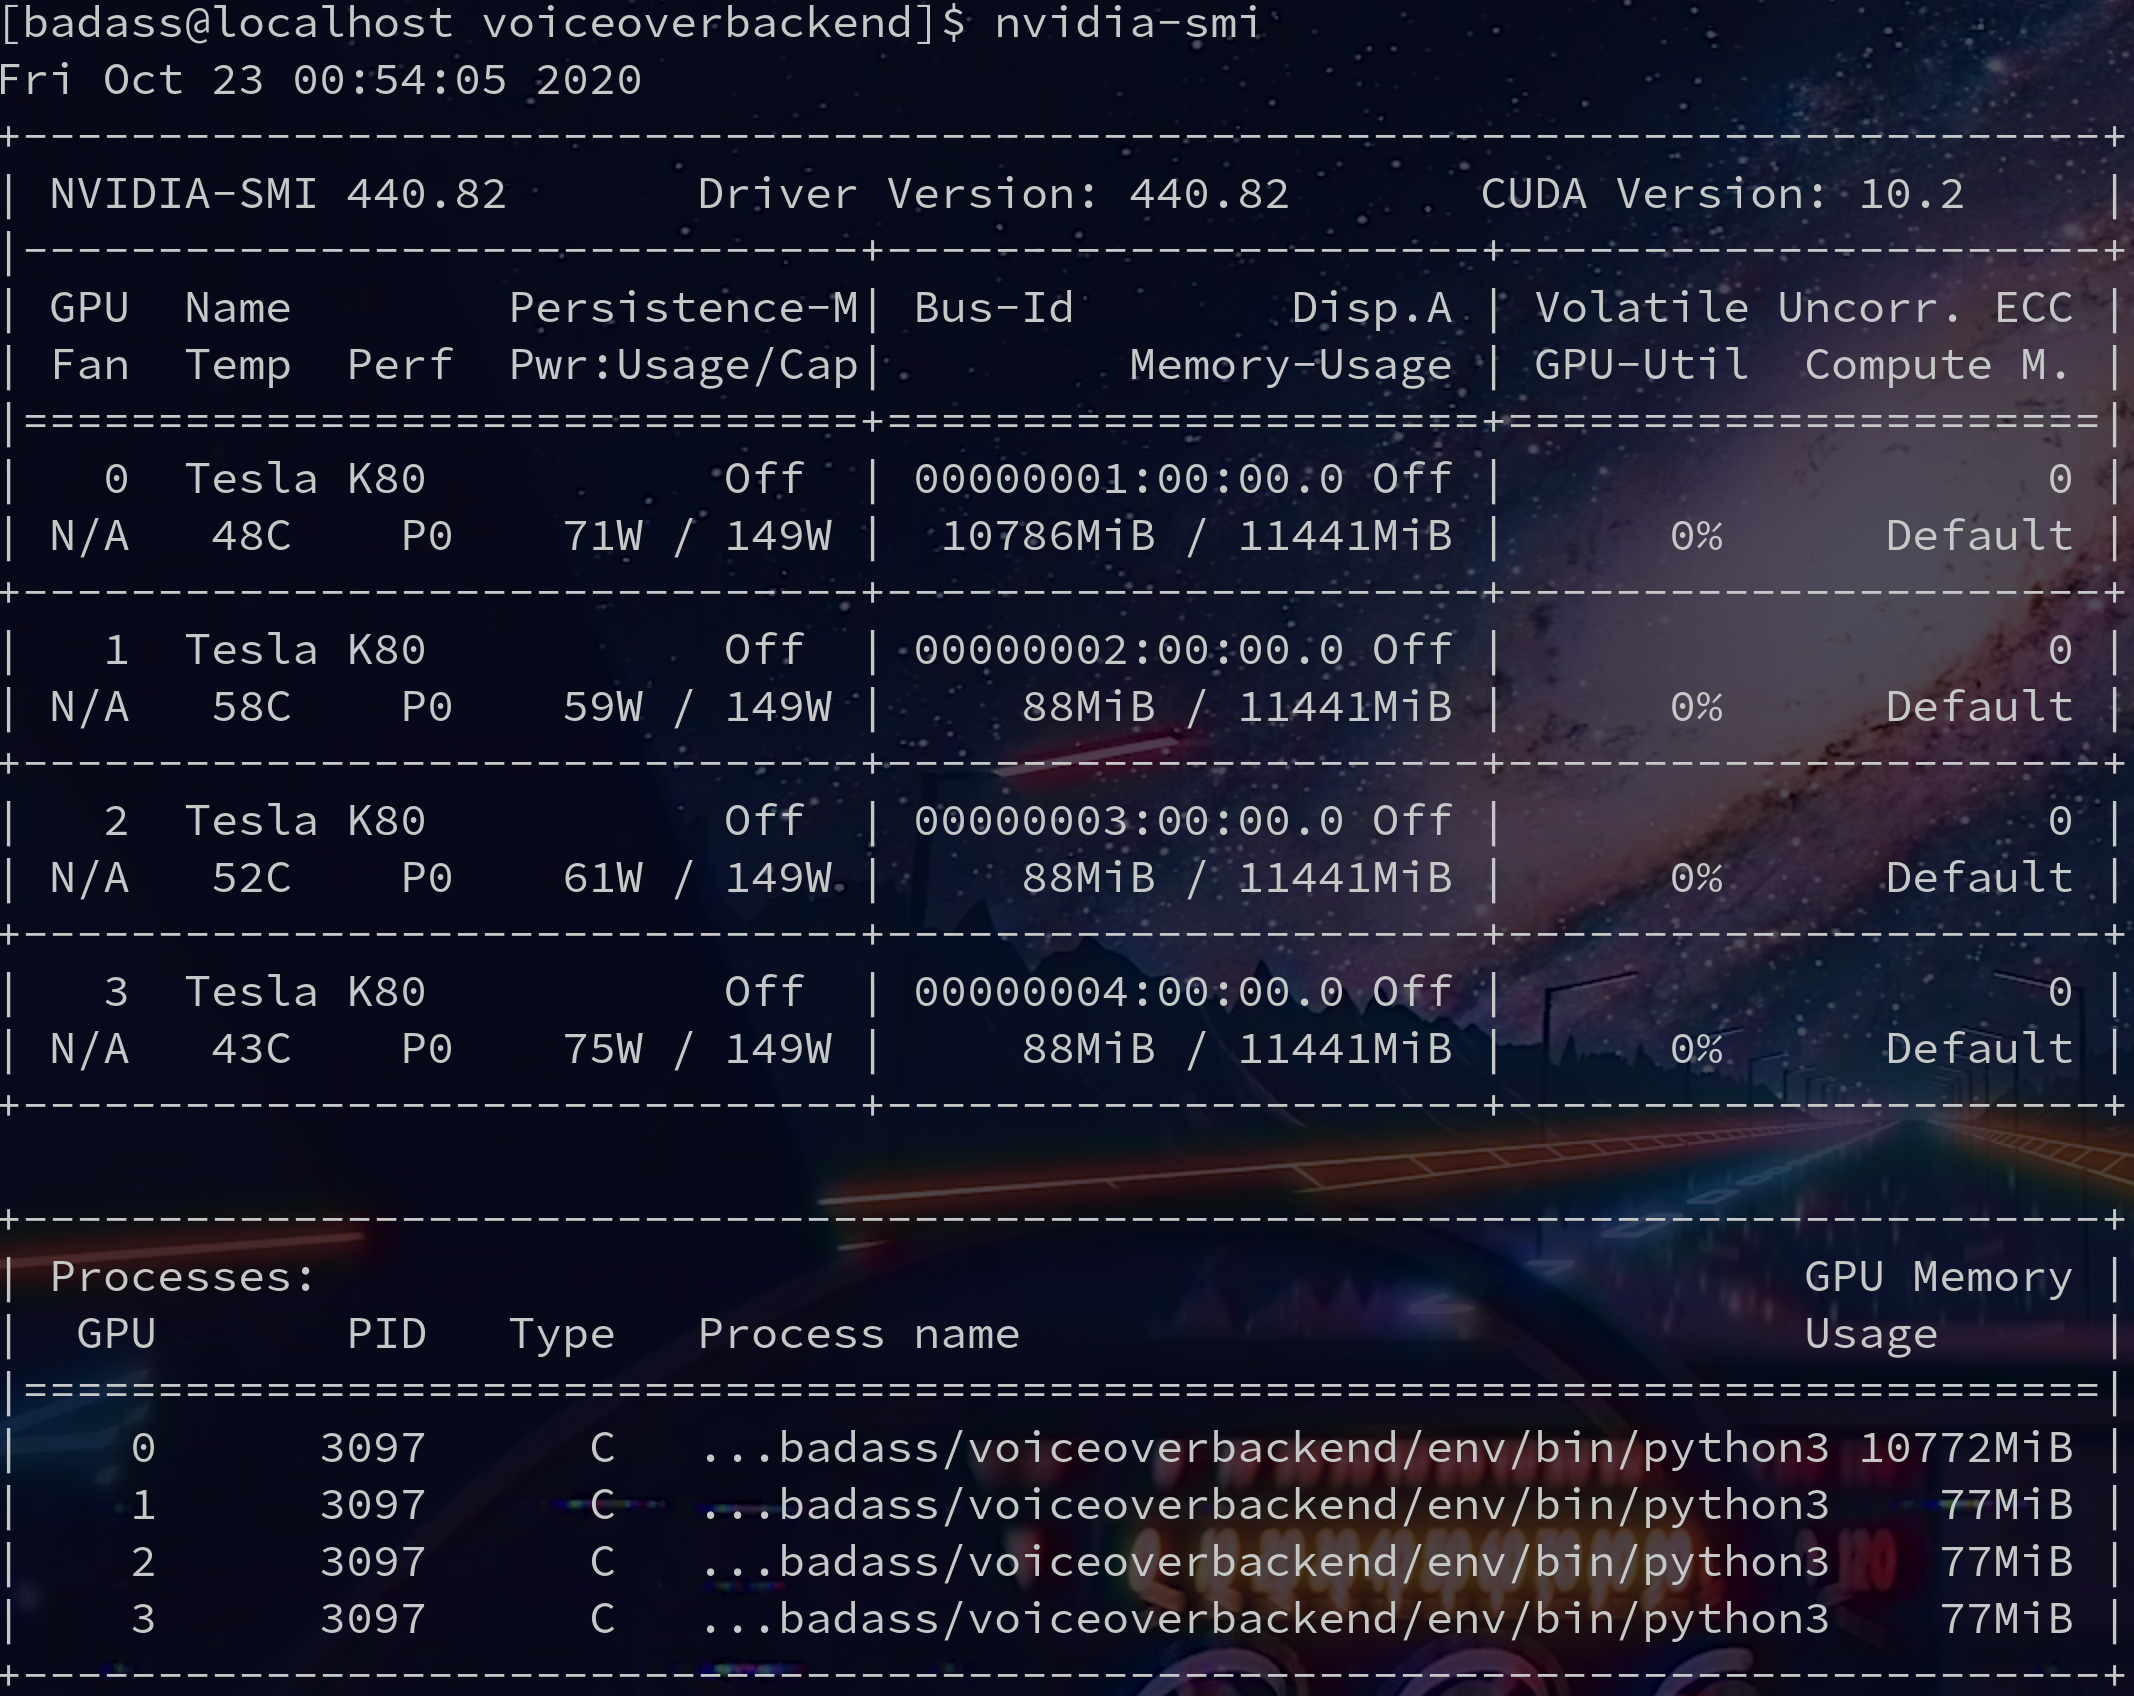
So I actually get back the sttWithMetadata results fine, however the GPU memory is never free'd, eventually causing out of GPU memory errors after multiple runs.
Before running code:
After running code and getting sttWithMetadata results as well as processing them:
This has been happening V 0.7.X, I thought maybe Jupyter labs was doing some weird memory management for me, but it still happens in prod.
Memory should be cleared after sttWithMetadata completes correct? Seems like these TF memory zombies are kinda common.
Somewhat unrelated but is it normal for only one of my GPU's to max on memory usage during STT? I vaguely remember something about GPU's not being able to pool memory effectively because of SLI/PCIE bottlenecks?
Also attaching some logs which confirm all my CUDA libs are happily being imported at runtime:
[2020-10-23 01:07:13,475: WARNING/ForkPoolWorker-18] converted audio
[2020-10-23 01:07:13,710: WARNING/ForkPoolWorker-18] /abooks/273600239346638305262718031627204631445.mp3
[2020-10-23 01:07:13,710: WARNING/ForkPoolWorker-18] None
[2020-10-23 01:07:13,710: WARNING/ForkPoolWorker-18] /home/badass/voiceoverbackend/media/abooks/273600239346638305262718031627204631445.mp3
[2020-10-23 01:07:13,710: WARNING/ForkPoolWorker-18] /home/badass/voiceoverbackend/media/abooks/273600239346638305262718031627204631445_16m>
TensorFlow: v2.2.0-24-g1c1b2b9
DeepSpeech: v0.8.2-0-g02e4c76
2020-10-23 01:07:13.781268: I tensorflow/core/platform/cpu_feature_guard.cc:143] Your CPU supports instructions that this TensorFlow binary>
2020-10-23 01:07:13.787099: I tensorflow/stream_executor/platform/default/dso_loader.cc:44] Successfully opened dynamic library libcuda.so.1
2020-10-23 01:07:41.615786: I tensorflow/core/common_runtime/gpu/gpu_device.cc:1561] Found device 0 with properties:
pciBusID: 0001:00:00.0 name: Tesla K80 computeCapability: 3.7
coreClock: 0.8235GHz coreCount: 13 deviceMemorySize: 11.17GiB deviceMemoryBandwidth: 223.96GiB/s
2020-10-23 01:07:41.616716: I tensorflow/core/common_runtime/gpu/gpu_device.cc:1561] Found device 1 with properties:
pciBusID: 0002:00:00.0 name: Tesla K80 computeCapability: 3.7
coreClock: 0.8235GHz coreCount: 13 deviceMemorySize: 11.17GiB deviceMemoryBandwidth: 223.96GiB/s
2020-10-23 01:07:41.617652: I tensorflow/core/common_runtime/gpu/gpu_device.cc:1561] Found device 2 with properties:
pciBusID: 0003:00:00.0 name: Tesla K80 computeCapability: 3.7
coreClock: 0.8235GHz coreCount: 13 deviceMemorySize: 11.17GiB deviceMemoryBandwidth: 223.96GiB/s
2020-10-23 01:07:41.618618: I tensorflow/core/common_runtime/gpu/gpu_device.cc:1561] Found device 3 with properties:
Memory should be cleared after
sttWithMetadatacompletes correct? Seems like these TF memory zombies are kinda common.
TensorFlow has a tendance to keep its memory until the process is gone, there's not a lot we can do there.
Anyone should be able to reproduce by running
sttWithMetadata()from the deepspeech-gpu python lib. This is the code I'm using:
Please try and repro without the python bindings ?
So I actually get back the
sttWithMetadataresults fine, however the GPU memory is never free'd, eventually causing out of GPU memory errors after multiple runs.
What errors ?
Also, sharing nvidia-smi might not be the best way to track memory leaks.
Also, we have valgrind coverage on the lib level (not binding level), aand non gpu is not leaking anything under our control. Given the differences between gpu and non gpu lib, its likely if there are leaks, its outsider of our scope anyway.
I dont have time in the forseable future to take a deeper look,sso if you can investigate with valgrind on pure lib and bindings to reduce the search space...
Thanks for taking the time to address my issue in such detail and push me in the right direction. I'd like to get this fixed as the leak is quite extreme 0 to max GPU memory usage on the master GPU after a single run of like 30secs of audio and then like a 65mb incremental bump on all the slave GPUs every execution. I don't have the exact errors this inevitably causes on hand unfortunately.
I've played with valgrind before and I'm happy to dig into this more, but I'm not sure it's warranted just yet.
From my due diligence I agree with your summation that this could be a binding level issue. And hopefully a fix is easy but I need to look into the code further.
From what I understand, Tensorflow will release your GPU memory if you ask really nicely.
However it also seems like tensorflow is being baked into some executable that's being wrapped by python here?
EDIT: Ohh I have a nifty idea to repro without the python bindings, will test and report back (not rn though 4am). I think I can get the search space a lot more narrow if not PR in a fix. Thanks again @lissyx !
However it also seems like tensorflow is being baked into some executable that's being wrapped by python here?
Yes libdeepspeech.so
I'd like to get this fixed as the leak is quite extreme 0 to max GPU memory usage on the master GPU after a single run of like 30secs of audio and then like a 65mb incremental bump on all the slave GPUs every execution. I don't have the exact errors this inevitably causes on hand unfortunately.
By default, tensorflow will allocate the whole gpu memory, this is something you see at training as well, so its unclear there how much depends on that expected behavior and how much is actual leak.
I think what may be happening is that the Model instance, despite running out of scope in your example code, does not immediately get GC'd by the Python interpreter and so DS_FreeModel never gets called and the session is not closed. Unfortunately we do not expose DS_FreeModel directly in the Python bindings, instead relying exclusively on Model.__del__. Maybe we should expose for cases like this.
Interesting, I'll have to explore Model.__del__ to see what goodies await. Are you saying that the DS_DreeModel is indirectly exposed there?
Exposing that call directly sounds like a good idea, especially considering that anyone using this DS python binding in an interactive python session or jupyter notebook will encounter unexpected exhausted GPU memory resources after a few consecutive runs.
From what I can tell, python will never GC the model until the primary thread/process dies (even if left running for 24hours).
Alternate solution to consider: Just run DS_FreeModel after sttWithMetadata? If that doesn't make sense in every scenario possibly control that behavior with an input param?
I'm currently working around the issue in 3 different ways:
Jupyter Notebooks Workaround:
Kill the notebook's virtual python kernel manually and restart it.
Interactive Python Session
Manually restart the interactive python session.
Production Server Running DS behind an API
Make sure all celery handlers die/restart after processing an API call with DS.
Providing direct access DS_FreeModel is probably your best bet. If it can be accessed indirectly via Model.__del__ I'll test to confirm it clears GPU memory as expected.
I've been kind of busy putting out some other fires but I'll test out more where I can. Would love to get some PRs up for docs/improvements if possible.
Interesting, I'll have to explore
Model.__del__to see what goodies await. Are you saying that the DS_DreeModel is indirectly exposed there?
https://github.com/mozilla/DeepSpeech/blob/master/native_client/python/init.py#L41-L44
From what I can tell, python will never GC the model until the primary thread/process dies (even if left running for 24hours).
So that would be consistent.
Alternate solution to consider: Just run DS_FreeModel after sttWithMetadata? If that doesn't make sense in every scenario possibly control that behavior with an input param?
No, unfortunately, it does not make sense and it will complexify the API for nothing, and in case like yours, Model.__del__ would be the way to go.