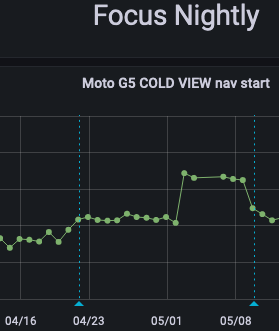
~28ms regression to start up around 4/21, all types
Both COLD VIEW and COLD MAIN show a regression from 4/19 to 4/21. Due to the noise of previous results, it's not clear exactly which date the regression begins:
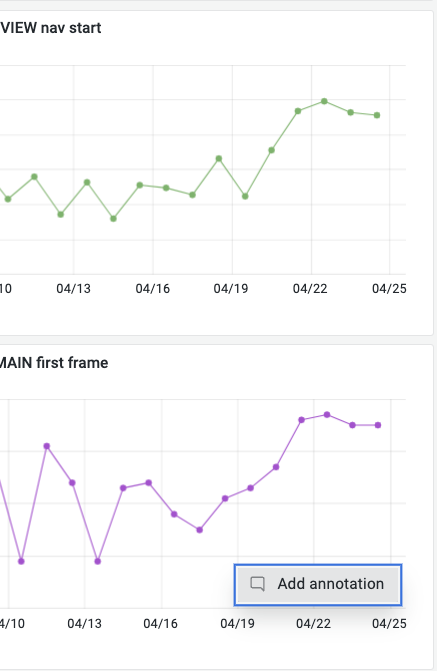
For COLD VIEW, we see:
- 4/19: 1.856s
- 4/20: 1.889s (-33ms)
- 4/21: 1.917s (-28ms; 61ms total)
For COLD MAIN:
- 4/19: 593ms
- 4/20: 597ms (-5ms)
- 4/21: 606ms (-9ms; 14ms total)
It seems like the regression occurred on either 4/20 or 4/21.
@mcomella Running python3 measure_start_up.py -c=25 --product=focus nightly cold_view_nav_start results.txt for two times on this commit I obtained two results with a 45ms difference between median values. I know that is normal to have different values but seems a pretty big difference. Is this expected?
==> results_v1.txt <==
{'max': 1810.0,
 'mean': 1652.24,
 'median': 1644.0,
 'min': 1607.0,
 'replicate_count': 25,
 'replicates': [1810.0, 1653.0, 1607.0, 1648.0, 1640.0, 1638.0, 1643.0, 1642.0,
                1623.0, 1634.0, 1627.0, 1652.0, 1650.0, 1619.0, 1644.0, 1651.0,
                1625.0, 1699.0, 1633.0, 1661.0, 1665.0, 1647.0, 1631.0, 1646.0,
                1718.0]}

==> results_v2.txt <==
{'max': 2131.0,
 'mean': 1758.04,
 'median': 1689.0,
 'min': 1619.0,
 'replicate_count': 25,
 'replicates': [1790.0, 1704.0, 1636.0, 1665.0, 1619.0, 1650.0, 1655.0, 1679.0,
                1671.0, 1633.0, 1655.0, 1689.0, 1625.0, 1632.0, 1658.0, 1859.0,
                2014.0, 1968.0, 1982.0, 1947.0, 1845.0, 1790.0, 1709.0, 1745.0,
                2131.0]}
@ionutbedregeanu Which device did you run on? On fenix on a Moto G5, we see a typical range of about 20ms and, since runs aren't usually on the extremes, the difference between two runs is usually less – 10-15ms. I don't have a good intuition for focus.
To debug, I looked at your results by graphing them (./perf-tools/analyze_durations.py --graph results_v1.txt) and I noticed an interesting pattern. Here's v1:
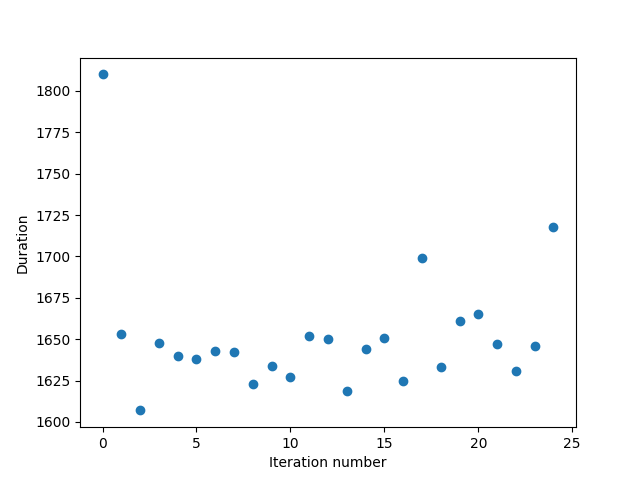
And v2:
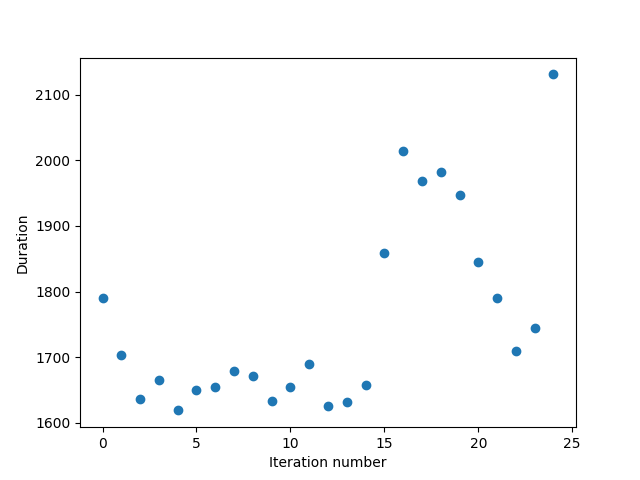
v2's last ~10 runs take longer than the average run in the rest of v2 and in v1. I wonder if something happened during the run – a few ideas I can think of are, did the device's screen turn off? Did your computer go to sleep? Did some state change in the app or device (e.g. it opted into an experiment, started from a different home screen, or ended on a different app screen)? Another possibility is that you're seeing the bimodal behavior we see in fenix's VIEW start up https://github.com/mozilla-mobile/fenix/issues/22144 but since that only happens on the last few results, that seems unlikely.
In any case, the pattern of the results of v2 seems atypical – I wonder if you'd continue seeing this if you tried running it again a few times.
Yeah, it seems that it was an isolated result. After another tests the results seems pretty much the same
After some tests I notice a regression added by https://github.com/mozilla-mobile/focus-android/pull/6897, but more like a spike
Before 6897 pr:
==> results.txt <==
{'max': 1804.0,
 'mean': 1653.44,
 'median': 1644.0,
 'min': 1603.0,
 'replicate_count': 25,
 'replicates': [1804.0, 1635.0, 1645.0, 1644.0, 1638.0, 1634.0, 1617.0, 1621.0,
                1624.0, 1603.0, 1720.0, 1670.0, 1671.0, 1668.0, 1627.0, 1692.0,
                1644.0, 1626.0, 1651.0, 1658.0, 1619.0, 1663.0, 1643.0, 1662.0,
                1657.0]}
On 6897 pr:
==> results.txt <==
{'max': 2128.0,
 'mean': 1950.48,
 'median': 2041.0,
 'min': 1619.0,
 'replicate_count': 25,
 'replicates': [1760.0, 1654.0, 1619.0, 1648.0, 1622.0, 1771.0, 1860.0, 1952.0,
                1967.0, 1993.0, 2055.0, 2027.0, 2033.0, 2063.0, 2128.0, 2061.0,
                2070.0, 2048.0, 2069.0, 2054.0, 2064.0, 2077.0, 2041.0, 2057.0,
                2069.0]}
After 6897 pr:
==> results.txt <==
{'max': 1840.0,
 'mean': 1658.08,
 'median': 1643.0,
 'min': 1622.0,
 'replicate_count': 25,
 'replicates': [1840.0, 1639.0, 1642.0, 1629.0, 1643.0, 1657.0, 1622.0, 1633.0,
                1663.0, 1638.0, 1643.0, 1659.0, 1638.0, 1644.0, 1643.0, 1653.0,
                1686.0, 1667.0, 1687.0, 1643.0, 1652.0, 1662.0, 1699.0, 1636.0,
                1634.0]}
Also after two runs I noticed a regression added by https://github.com/mozilla-mobile/focus-android/pull/6911 Device: Pixel 3a Android 11, fresh install every time
==> results.txt <==
{'max': 2078.0,
 'mean': 1998.48,
 'median': 2047.0,
 'min': 1623.0,
 'replicate_count': 25,
 'replicates': [1830.0, 1656.0, 1623.0, 2024.0, 2047.0, 1999.0, 2017.0, 1936.0,
                1955.0, 2058.0, 2061.0, 2030.0, 2062.0, 2046.0, 2060.0, 2060.0,
                2067.0, 2058.0, 2078.0, 2074.0, 2034.0, 2057.0, 2051.0, 2025.0,
                2054.0]}
I made another session of testing and git bisect in AC to find the main cause of regression mentioned above(https://github.com/mozilla-mobile/focus-android/pull/6911) and it results that this commit added the regression
Command: python3 measure_start_up.py -c=50 --product=focus nightly cold_view_nav_start --force results.txt
Device: Pixel 3a Android 11
Build: Focus Nightly(fresh build on every session of testing)
Unfortunately I don't have a device with an android version < 11 and I can't set the permissions to capture the profile using the Debug API
I will unassign this from me, maybe someone else can help
The Firefox Profiler can capture start up from the time Gecko starts and onward: see these instructions. Since the regression comes from a GeckoView upgrade, there is a good chance we'd be able to capture the regression in that profile (unless it occurs while GeckoView is starting rather than afterwards).
@mcomella I followed the above instructions, but the comparator didn't find any differences between them, so probably the difference is while GeckoView is starting.
Tested scenario
- Follow Manual configuration steps
- Install a fresh build of Focus Nightly
- Go to app home screen(now the device is available in Mozilla Profiler)
- Start Recording from Mozilla Profiler
- Navigate to wikipedia
- Stop recording
Public profile before https://github.com/mozilla-mobile/focus-android/pull/6911
https://share.firefox.dev/3HaQzIq
Public profile after
https://share.firefox.dev/3H6swKm
Differences between profiles
https://profiler.firefox.com/compare/network-chart/?globalTrackOrder=340w2&hiddenGlobalTracks=0134&hiddenLocalTracksByPid=18342%20from%20profile%201-0~19652%20from%20profile%202-0&localTrackOrderByPid=18342%20from%20profile%201-0~19652%20from%20profile%202-0&profiles[]=https%3A%2F%2Fshare.firefox.dev%2F3HaQzIq&profiles[]=https%3A%2F%2Fshare.firefox.dev%2F3H6swKm&thread=2&v=6
@ionutbedregeanu Our nightly runs only test cold start ups but this profile doesn't appear to be of a cold start up. In that case, you'd see the main thread maxed out for a few seconds at the start of the profile, like this profile: https://share.firefox.dev/3MBwwDY Make sure to force stop the app (in the Android UI or through adb) before launching.
Also, I noticed the profile was taken on a Pixel 3 – this is a pretty fast device so you'll probably have difficulty seeing a small difference like 28ms from the Moto G5 which our nightly tests run on. For context, 28ms is close to the smallest regression we can detect on that device. It would be preferable to take these profiles on a low-end device. fwiw, we want to change our reference device to the Galaxy A51, so you can use that if you happen to have one of those.
I already talked with the team to transfer me a device with a lower android version, so I will postpone this ticket until then. Or as I said above, if someone else can help feel free to take the ticket
Unfortunately I don't have a device with an android version < 11 and I can't set the permissions to capture the profile using the Debug API
You don't need to prioritize this work but FYI I added instructions for taking profiles on Android 11: https://wiki.mozilla.org/Performance/Fenix/Debug_API#Usage_for_start_up:_Android_11_and_later
I built the startup trace for both scenarios, before and after https://github.com/mozilla-mobile/android-components/pull/12027 This is the report for both traces https://profiler.firefox.com/compare/calltree/?globalTrackOrder=0w2&profiles[]=https%3A%2F%2Fshare.firefox.dev%2F3uuMee0&profiles[]=https%3A%2F%2Fshare.firefox.dev%2F3RiXTGs&thread=0&v=6 But I don't fully understand the legend and how the report should be read to see the differences @mcomella Can you help me with this?
I find the Profiler Compare View to be complex to navigate and I've only rarely found it more intuitive than by comparing two profiles by switching quickly between each profile in separate tabs. I set the profiles to the "Stack Chart" view and make sure they're set to a comparable range (e.g. pick a marker to end the range on). I might recommend trying that if the Profiler Compare is unintuitive.
For the Profiler Compare View, it looks like the link provided is comparing the same two profiles (I determined this by clicking each "main" track in the "Stack Chart" view and seeing that it didn't change). It might make more sense when you load in two separate profiles.
fwiw, @Amejia481 is also familiar with at least the first method if you have more questions.
I apologize for not responding sooner – I just saw this now.
(e.g. it opted into an experiment, started from a different home screen, or ended on a different app screen)
@mcomella not sure if the tests are taking into consideration that focus added a splash screen that is delaying startups by up to 2 seconds to be able to download experiments and run them when the app starts.
Should we disabled experiments for this tests (also in Fenix)? I'm not sure if they are really helping us to measure a real startup and could cause noise while testing?
I tested this on a Samsung S7 with Android 8.0 with Power saving mode activated. The tests were done using at least 100 runs because there was a lot of variation between results and 25 or 50 runs would not give consistent/reliable mean/median values.
Following the steps from https://github.com/mozilla-mobile/perf-tools I tested with using
python3 measure_start_up.py -c=100 --product=focus nightly cold_view_nav_start
Based on the reported regression time range I focused my tests on Focus on the following PRs merged between April 20-22.
Results on Focus:
The following were used to have a good baseline:
| Merge day | Revision # | Title | # runs | Max | Mean | Median | Min | Good | Graph |
|---|---|---|---|---|---|---|---|---|---|
| 18 | a8683cc | Update to AC 101.0.20220418190127 | 100 | 2013 | 1808 | 1818 | 1562 | ✅ | link |
| 19 | 463ed77 | Import strings from android-l10n | 100 | 2017 | 1800 | 1789 | 1568 | ✅ | link |
| 19 | 6eaa634 | Update to AC 101.0.20220419190137 | 100 | 1984 | 1775 | 1791 | 1524 | ✅ | link |
| 20 | 9727268 | Update to AC 101.0.20220420143047 | 100 | 2552 | 1807 | 1808 | 1537 | ✅ | link |
The next ones are in merge order
| Merge day | Revision # | Title | # runs | Max | Mean | Median | Min | Good | Graph |
|---|---|---|---|---|---|---|---|---|---|
| 21 | 3cd24bc | Update to AC 101.0.20220421143106 | 100 | 1997 | 1800 | 1809 | 1561 | ✅ | link |
| 21 | e522505 | Update to AC 101.0.20220421190113 | 150 | 2191 | 1881 | 1877 | 1564 | ❌ | link |
| 21 | b68eb20 | Update to AC 101.0.20220423143138 | 100 | 2189 | 1870 | 1848 | 1585 | ❌ | link |
The e5225054 changeset which updates the A-C version is the same @ionutbedregeanu found to have introduced the regression and the To note that that PR after which the regression in seen on Focus was opened on Apr 21, 2022, 10:20 PM GMT+3 so the GV update proposed as introducing the regression in A-S in https://github.com/mozilla-mobile/focus-android/issues/6923#issuecomment-1150124016 seems unlikely as there was another GV update on Apr 20 and even another GV update merged on Apr 21, 2022, 5:01 PM GMT+3.
I then moved to test on AC the PRS starting from Apr 20 but found the results to be inconclusive and so expanded the testing to cover Apr 19 also with this AC list of merges and got the following data:
Results on A-C:
| Merge day | Revision # | Title | # runs | Max | Mean | Median | Min | Good | Graph |
|---|---|---|---|---|---|---|---|---|---|
| 19 | 8905464 | Update suggestions everytime SuggestionFetcher updates | 100 | 2250 | 1882 | 1872 | 1528 | ? | link |
| 19 | e07544f | Update to GV 101.0.20220419093010 | 100 | 2104 | 1846 | 1871 | 1508 | ? | link |
| 20 | 01012c1 | Import strings from android-l10n | 100 | 2197 | 1813 | 1830 | 1540 | ? | link |
| 20 | 4687fa5 | Update to GV 101.0.20220420094247 | 100 | 2146 | 1849 | 1857 | 1585 | ? | link |
| 20 | d8cc5fb | Webcompat interventions | 100 | 2040 | 1872 | 1868 | 1613 | ? | link |
| 20 | 1d0457a | Infer mime type | 100 | 2230 | 1813 | 1845 | 1539 | ? | link |
| 20 | be4dbf1 | Added features to support A-S | 100 | 2277 | 1834 | 1856 | 1539 | ? | link |
| 21 | 3d66c19 | Update to GV 101.0.20220421094346 | 100 | 2098 | 1842 | 1854 | 1577 | ? | link |
| 22 | af3eaca | Support auto hiding edit action end | 100 | 2283 | 1885 | 1877 | 1554 | ? | link |
| 22 | 88156d1 | Update to GV 101.0.20220422100351 | 100 | 2132 | 1839 | 1842 | 1564 | ? | link |
TheA-C tests were done using https://github.com/mozilla-mobile/focus-android/commit/3cd24bc882d6d77f5b2ff8059535697008636136 as a base in Focus and involved executing clean in A-C followed by a rebuild of the Focus project.
The above results on A-C seem inconclusive to me though. I'll check with Ionut and maybe try testing on another device.
Note that in my tests I didn't see the new splashscreen, as expected as it was merged in May.
All my tests can be seen here.
Saw that a similar regression occured on Fenix also which would confirm the issue stems from AS and potentially GV.
| 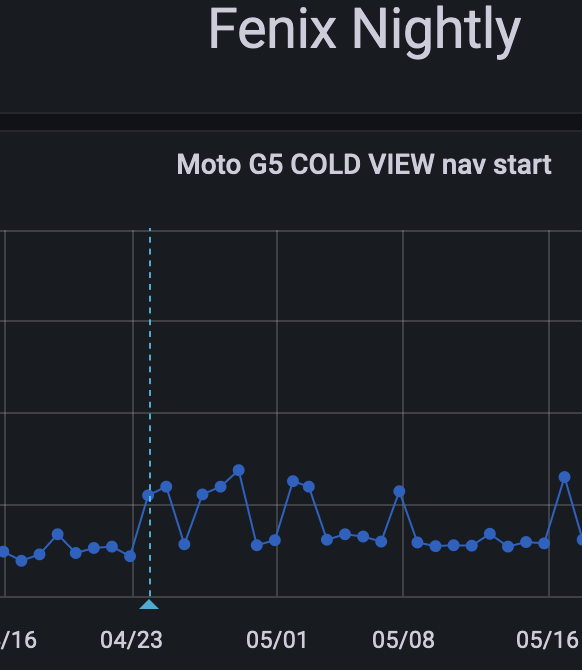 |
|  |
|
Spoke with @ionutbedregeanu about the next steps and concluded on me testing on AC on another personal device I have a Nokia 6.1 with Android 10.
Started testing again this AC list of merges on a Nokia 6.1 with Android 10 and got the following data:
Results on A-C:
| Merge day | Revision # | Title | # runs | Max | Mean | Median | Min | Good | Graph |
|---|---|---|---|---|---|---|---|---|---|
| 18 | f12e657 | Import strings from android-l10n | 100 | 4813 | 4713 | 4713 | 4625 | ? | link |
| 18 | 9168dff | Update to GV 101.0.20220418091627 | 25 | 4802 | 4731 | 4737 | 4665 | ? | link |
| 18 | ac93f1f | Update compose to 1.1.1 and Kotlin to 1.6.10 | 50 | 4830 | 4738 | 4738 | 4768 | ? | link |
| 19 | 890546 | Update suggestions everytime SuggestionFetcher updates | 50 | 4938 | 4820 | 4823 | 4697 | ? | link |
| ... | |||||||||
| 22 | 88156d1 | Update to GV 101.0.20220422100351 | 50 | 4907 | 4768 | 4757 | 4675 | ? | link |
Which despite showing a lower variation between min and max it is still too high to allow for confidently identifying which changeset introduced the regression. Results can be seen in the same folder as the ones from above - https://drive.google.com/drive/u/1/folders/1CQ9MhWZUF4WEzJaGgW_WPolBGfkR3JM1
I can try testing using a Pixel 3 with Android 11 (same as Ionut) in the hope that although the times will be lower there will be less noise and a regression can be identified.
Seeing that bisecting commits may give false results because of differences between runs higher than the reported regression I tested a block of commits around April 21st from this AC list of merges on a Pixel 3 with Android 11 and got the following data:
Results on A-C:
| Merge day | Revision # | Title | # runs | Max | Mean | Median | Min | Good | Graph |
|---|---|---|---|---|---|---|---|---|---|
| 19 | e07544f | Update to GV 101.0.20220419093010 | 25 | 876 | 640 | 613 | 592 | ✅ | link |
| 20 | 01012c1 | Import strings from android-l10n | 25 | 874 | 657 | 623 | 597 | ✅ | link |
| 20 | 4687fa5 | Update to GV 101.0.20220420094247 | 30 | 903 | 645 | 622 | 609 | ✅ | link |
| 20 | d8cc5fb | Webcompat interventions | 100 | 1011 | 660 | 630 | 600 | ✅ | link |
| 20 | 1d0457a | Infer mime type | 30 | 909 | 640 | 612 | 590 | ✅ | link |
| 20 | be4dbf1 | Added features to support A-S | 30 | 946 | 668 | 629 | 610 | ✅ | link |
| 21 | f0ebd29 | Import strings from android-l10n | 100 | 898 | 626 | 608 | 588 | ✅ | link |
| 21 | 3d66c19 | Update to GV 101.0.20220421094346 | 100 | 1292 | 730 | 722 | 590 | ❌ | link |
| 21 | 6d4ff98 | Disable auto report on the AndroidManifest | 100 | 1360 | 762 | 717 | 590 | ❌ | link |
| ... | |||||||||
| 22 | 88156d1 | Update to GV 101.0.20220422100351 | 25 | 770 | 717 | 709 | 691 | ❌ | link |
Seems like the results are more consistent on this device and they indicate https://github.com/mozilla-mobile/android-components/pull/12043 introduced the regression.
@mcomella Tried profiling the startup with using the steps from https://github.com/mozilla-mobile/focus-android/issues/6923#issuecomment-1169238181 but by starting the app with measure_start_up.py -c=1 --product=focus nightly cold_view_nav_start as an easy way to also measure the time needed since I suspected the inherent startup differences may be higher than the searched for regression.
And indeed I saw any numbers between 620ms and 1292ms so any taken profiles would not allow the confidence needed to confirm a regression in GV.
Wanted to confirm with you that at this point the next steps for investigating this and trusting the results would be using measure_start_up.py --product=geckoview nightly cold_view_nav_start (the script would need minor modifications).
I don't have now the setup to build GeckoView locally so I would report the regression to Bugzilla and leave the team there continue the investigation.
@Mugurell From your previous comment https://github.com/mozilla-mobile/focus-android/issues/6923#issuecomment-1209002708, we can conclude the regression occurred due to a GV update. As you point out, the easiest way to find the root cause of the regression would be to bisect the commits to GeckoView (either by changing the version of GV in fenix or with GVE). Unfortunately, the tools don't make this easy currently. The second easiest method is usually to take profiles.
I don't have now the setup to build GeckoView locally so I would report the regression to Bugzilla and leave the team there continue the investigation.
This makes sense to me but it depends on how the GV team and the fenix team agree to handle regressions in GV. If you file an issue in Bugzilla, please add the "Performance: ?" flag.
And indeed I saw any numbers between 620ms and 1292ms so any taken profiles would not allow the confidence needed to confirm a regression in GV.
You generally want to compare a profile before the regression and after the regression. If there is too much variance in duration such that they're incomparable, one technique I use is to take several profiles for each scenario (5? More?), take the shortest for each (e.g. I often set the track to the first doOnPreDraw marker and compare the length at the top left), and compare those. While this isn't perfect, you're generally getting the run with minimal noise for each scenario which is more comparable than two runs with arbitrary amounts of noise.
Sorry for my slow update here, my trusty Pixel 3 had to be sent for repair.
Based on the Focus data from https://github.com/mozilla-mobile/focus-android/issues/6923#issuecomment-1206192477 I followed the steps from https://profiler.firefox.com/docs/#/./guide-remote-profiling and https://profiler.firefox.com/docs/#/./guide-startup-shutdown?id=firefox-for-android to profile the startup of official Focus Nightly builds (arm64-v8a) on a Pixel 3 with Android 12.
At a quick glance the data is not consistent enough, that's why I've taken multiple profiles following the same steps:
- with "Remote debugging via USB/Wi-Fi" disabled
- with the latest Release (107.0) of Firefox for Mac installed and
about:debuggingopened -
adb shell am start-activity -d "https://www.mozilla.org/" -a android.intent.action.VIEW org.mozilla.focus.nightly - In the newly opened app I then enabled "Remote debugging via USB/Wi-Fi"
- connected to the app in
about:debuggingon Desktop - clicked "Start recording" -> "Capture profile"
Results:
| for the "good" build | for the "bad" build |
|---|---|
| https://share.firefox.dev/3tSmGXy | https://share.firefox.dev/3ET2c76 |
| https://share.firefox.dev/3UX238g | https://share.firefox.dev/3GyDfiF |
| https://share.firefox.dev/3Ov5eBz | https://share.firefox.dev/3TTa5hj |
| https://share.firefox.dev/3tXOLMN | https://share.firefox.dev/3U078LU |
| https://share.firefox.dev/3tPzIoH | https://share.firefox.dev/3OqVUin |
@mcomella @MarcLeclair Please advise.
Moved to bugzilla: https://bugzilla.mozilla.org/show_bug.cgi?id=1802642
Change performed by the Move to Bugzilla add-on.