grafana-utils
 grafana-utils copied to clipboard
Grafana 5+ utils

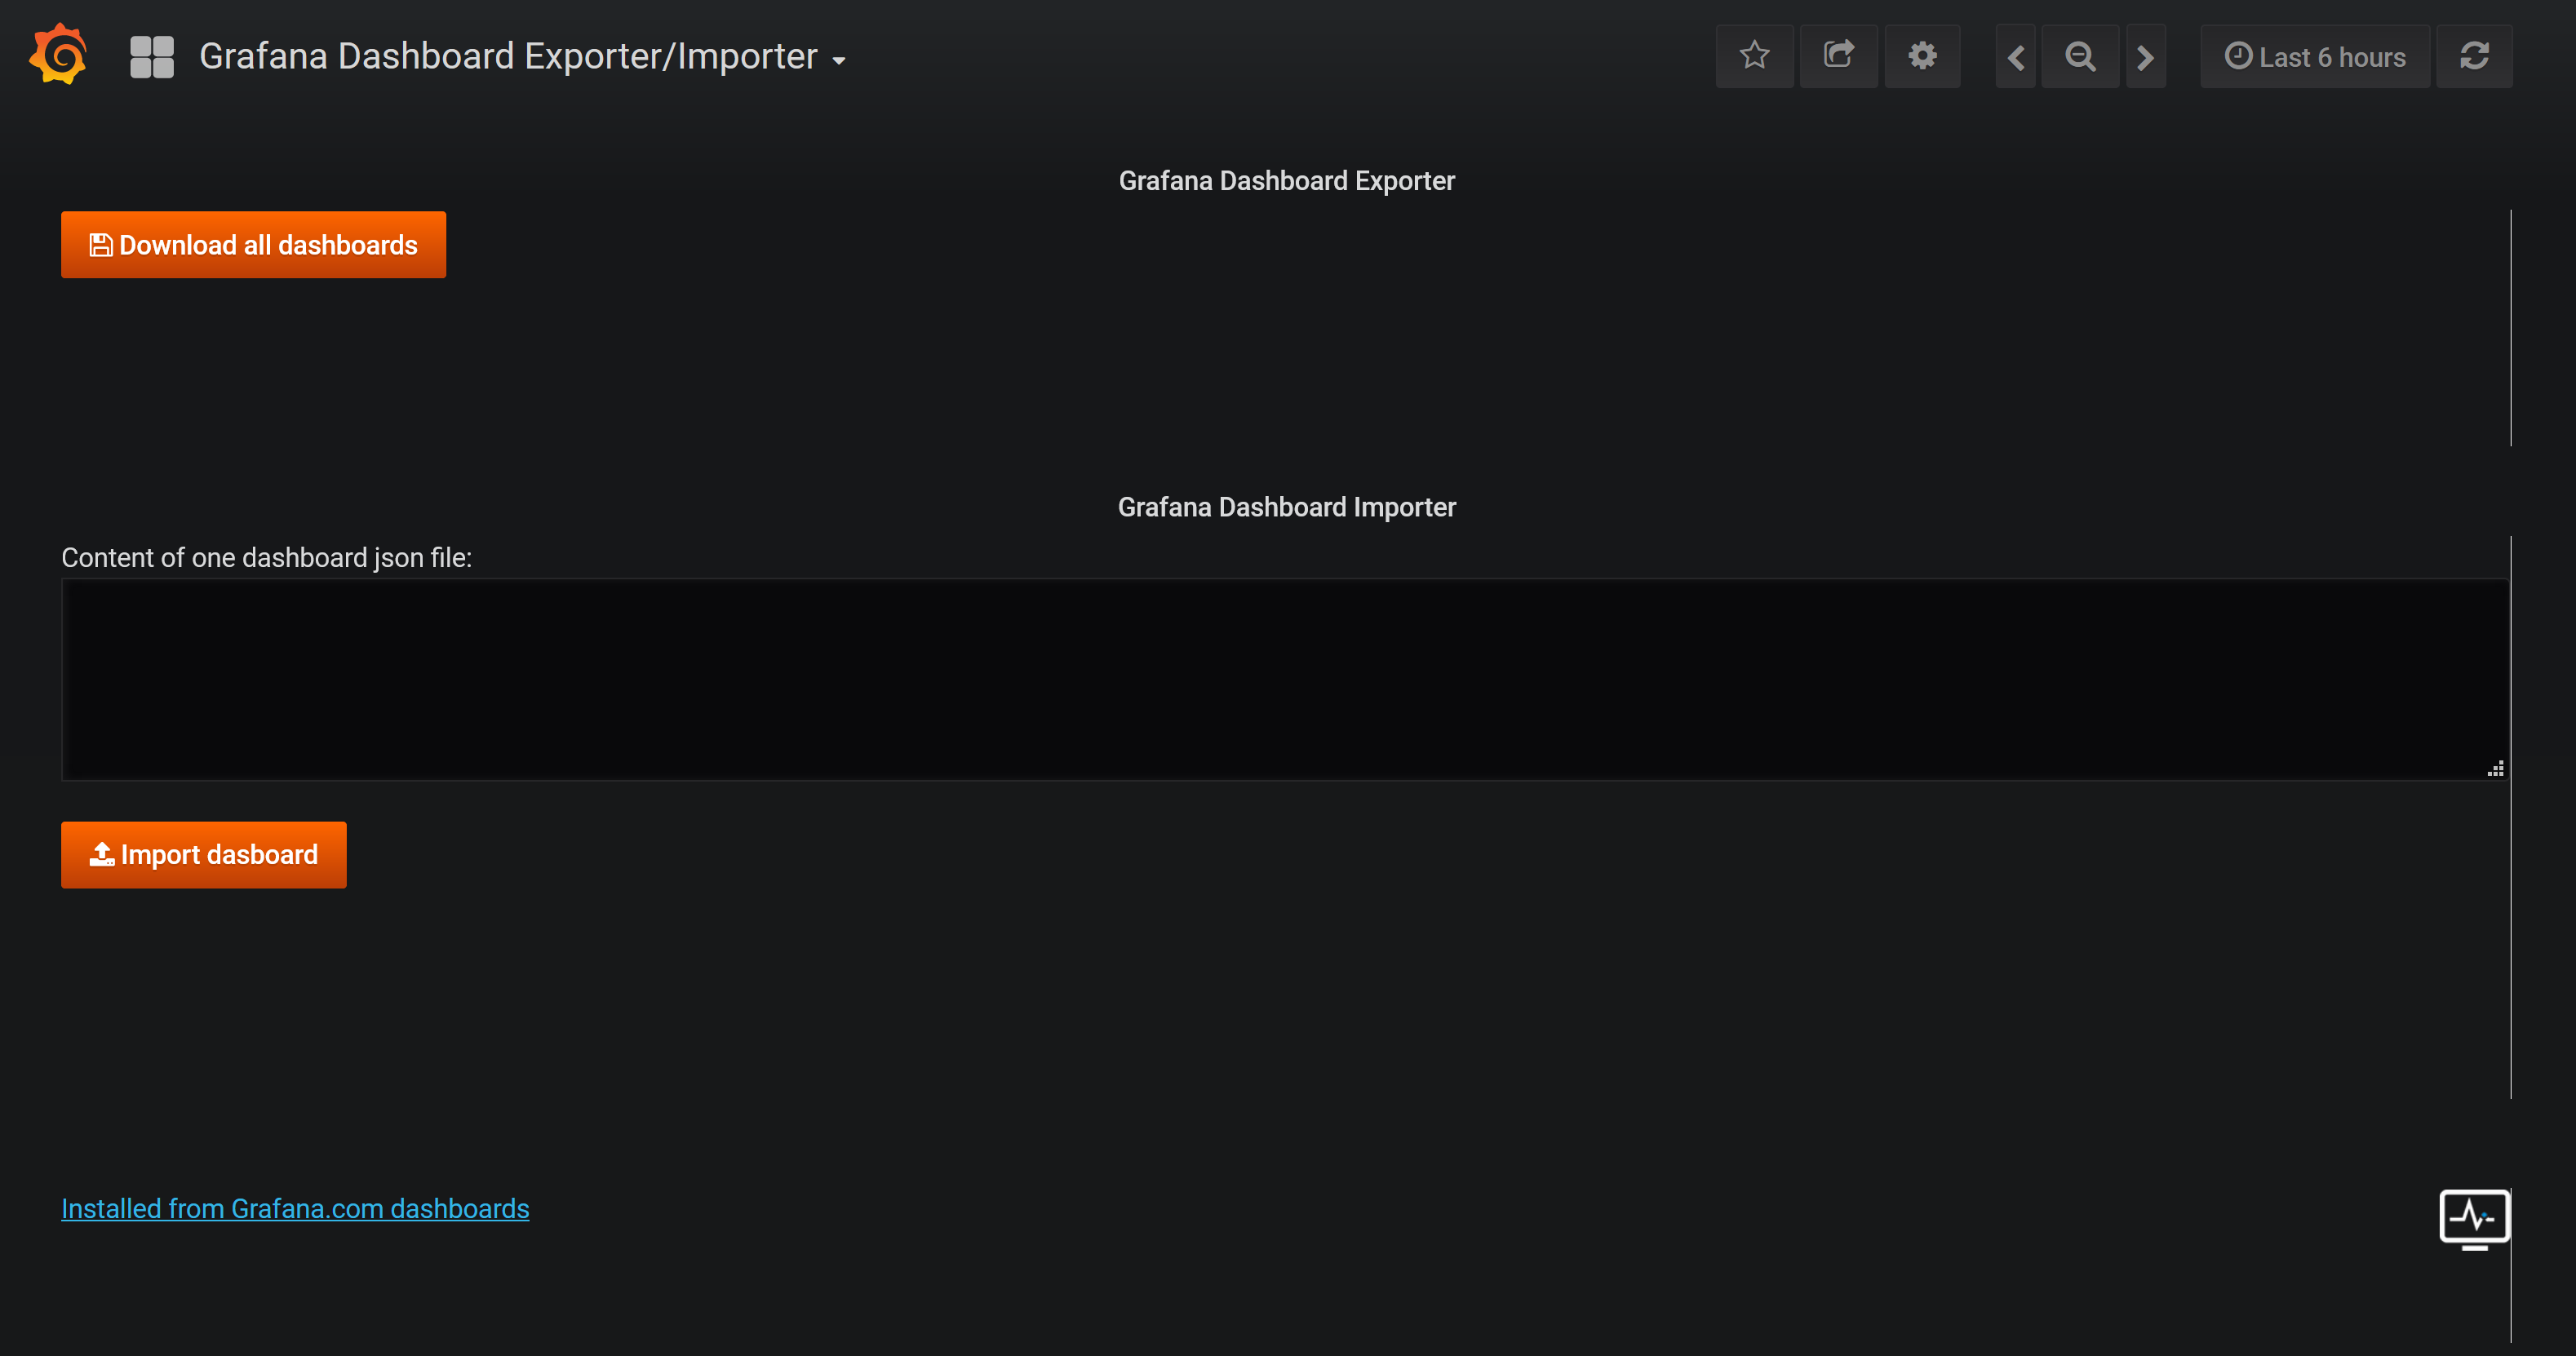
Grafana Dashboard Exporter/Importer
Export/import Grafana dashboards (Grafana 5+).
Dashboard
Dashboard restore operation
Use dashboard API to restore dashboard. For example:
cat <exported-dashboard.json> | jq '. + {overwrite: true}' | curl -X POST \
-H "Content-Type: application/json" -H "Authorization: Bearer <api-key-with-write-permissions>" \
<grafana-uri>/api/dashboards/db -d @-
When importing dashboards for the first time reset the id:
cat <exported-dashboard.json> | jq '. * {overwrite: true, dashboard: {id: null}}' | curl -X POST \
-H "Content-Type: application/json" -H "Authorization: Bearer <api-key-with-write-permissions>" \
<grafana-uri>/api/dashboards/db -d @-
Grafana 6+ users
The text panel does no longer by default allow unsantizied HTML, which is required to run custom Javascript code in the dashboard.
To enable unsafe Javascript execution in text panels enable the settings disable_sanitize_html under the section [panels] in your Grafana ini file, or set env variable GF_PANELS_DISABLE_SANITIZE_HTML=true.
Author
Devops Monitoring Expert, who loves monitoring systems and cutting/bleeding edge technologies: Docker, Kubernetes, ECS, AWS, Google GCP, Terraform, Lambda, Zabbix, Grafana, Elasticsearch, Kibana, Prometheus, Sysdig,...
Summary:
- 3000+ GitHub stars
- 20 000+ Grafana dashboard downloads
- 1 000 000+ Docker image pulls
Professional devops / monitoring / consulting services:
![]()