dotplot support for counts
I really like dotplots, and when presenting plots for both continuous and count data, I would like to be able to use the ggdist dotplots to have the same visual style, but also be able to take into account that count is special.
For example taking the data used in https://dansblog.netlify.app/posts/2022-09-04-everybodys-got-something-to-hide-except-me-and-my-monkey/everybodys-got-something-to-hide-except-me-and-my-monkey.html
and I can control the bin placement in histogram
ggplot(data=activity_20minms80_scaled,aes(x=active_bins))+geom_histogram(center=0,bins=80)
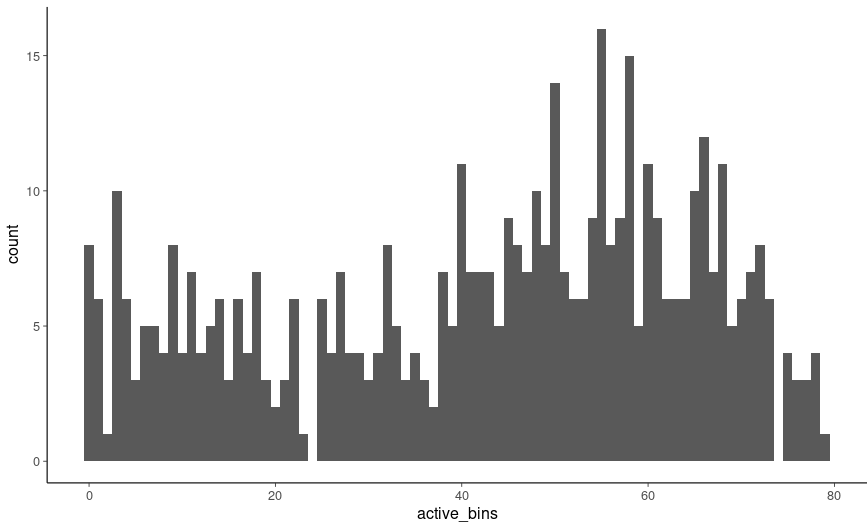
but I would prefer dots instead of bars.
I could use geom_dotplot
ggplot(data=activity_20minms80,aes(x=active_bins))+geom_dotplot(binwidth=1)
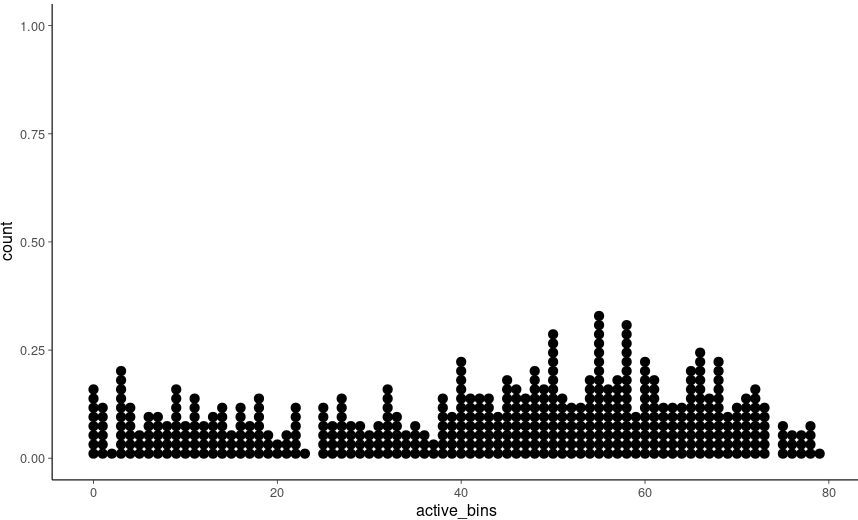
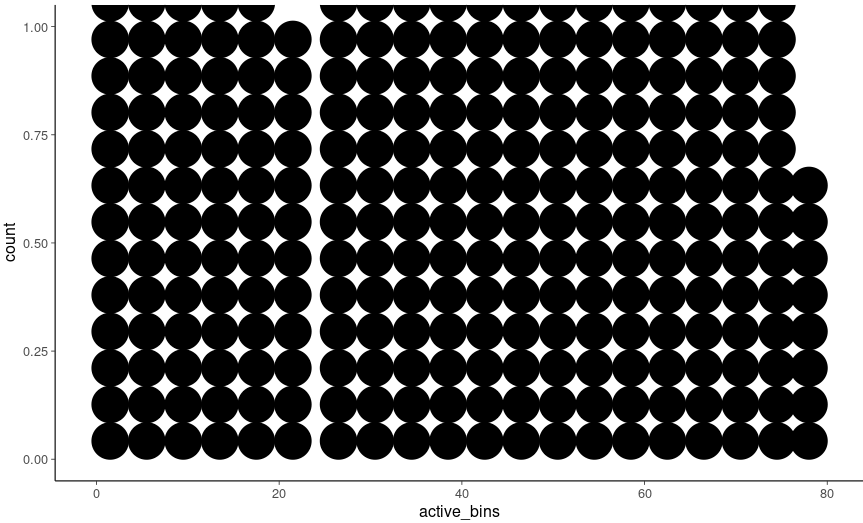
but it doesn't look as nice as ggdist dotplots, and it has strange scaling issues like
ggplot(data=activity_20minms80,aes(x=active_bins))+geom_dotplot(binwidth=4)
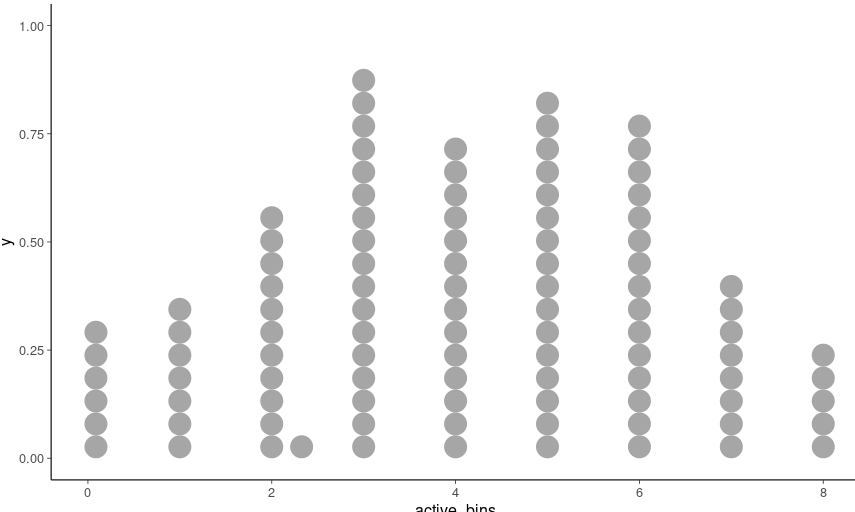
geom_dots looks nice with default options
ggplot(data=activity_20minms80,aes(x=active_bins))+geom_dots()
but it's difficult to ask for a dot plot that would correspond to histogram with a bin at each count value. For bigger data, it could be useful to be state how many consecutive count values are presented with one column of dots, like in histogram you could use geom_histogram(center=0.5,bins=40)
Another example with count data (maybe a bit extreme on having a low number of counts)
ggplot(data=activity_2mins,aes(x=active_bins))+geom_dots()

It would be nice to be able to control the number of dots, but keep them on x axis on the integer values. Now trying to control the number of dots with
ggplot(data=activity_2mins,aes(x=active_bins))+stat_dots(quantiles=100)
is a bit awkward but also produces dots not at the integer values
I'm also fine if you tell that I shouldn't use dotplots for count data.
This is a great list of use cases! You absolutely should be able to use dots for count data, and it's been on my list but I haven't gotten around to it :). This is very helpful for thinking through the set of things we need to support.
Two related issues:
- one on aligning bins #101
- one on an alternative to dealing with bins that are too tall in discrete data that would be to put multiple columns within a bin: #100
As for when: could be relatively soon on my list, since I've also been playing with blurry dotplots for mcse recently (so I'm already in a "dotplot mood"), but "relatively soon" is not well defined since the quarter just started ;)
Some updates on this on the dev branch:
Re: applying quantiles but respecting integer bins
This should be possible now if you let ggplot know that the input data is discrete, e.g. by making it a factor:
ggplot(activity_2mins, aes(x = factor(active_bins))) +
  stat_dots(aes(group = NA), quantiles = 100)
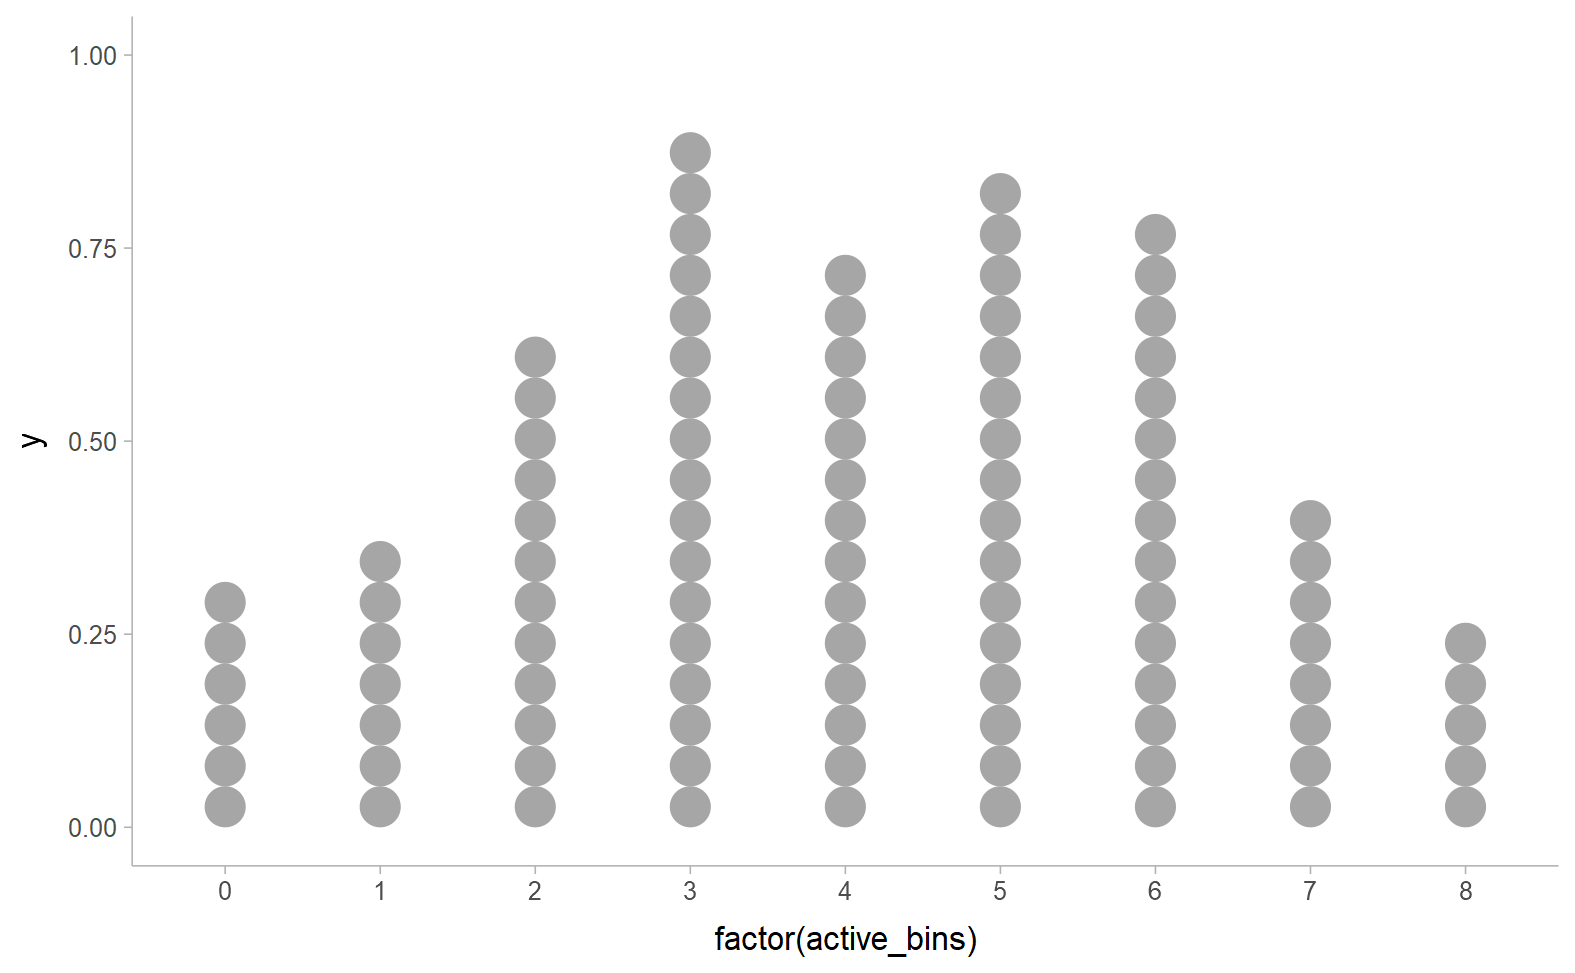
It's a bit awkward because you also have to set the group to NA, as otherwise ggplot automatically sets group to all combinations of discrete variables (including x in this case), which would lead quantiles to be calculated separately within each bin.
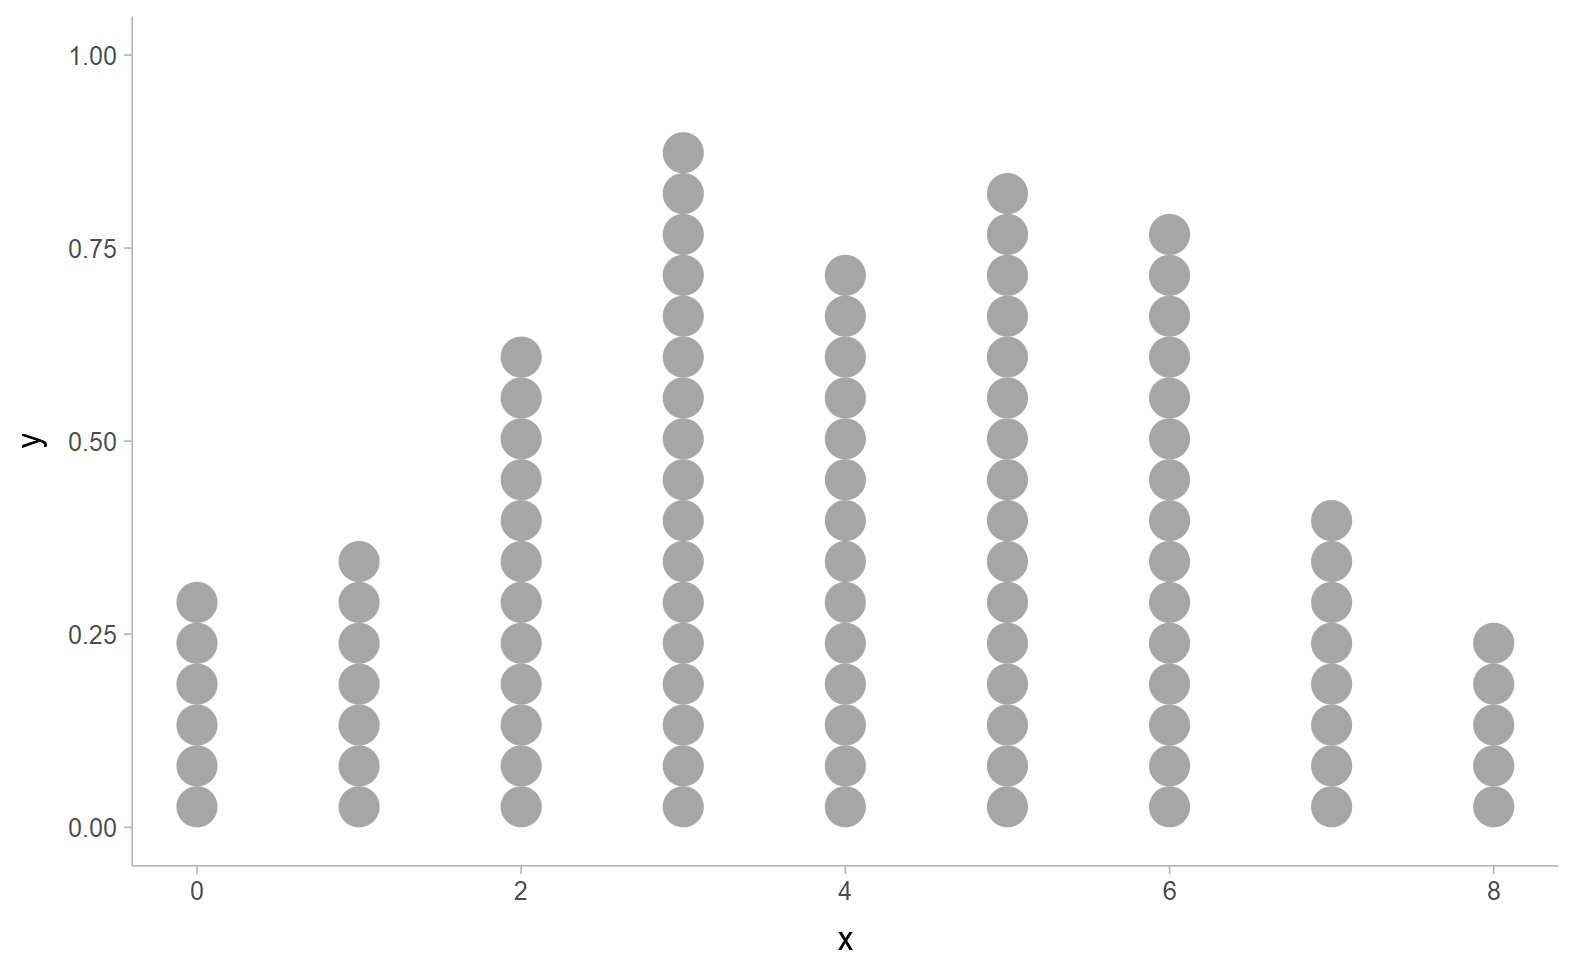
If you want to avoid having to make the x scale discrete, you can also (in dev version) wrap the dist in an rvar, and stat_dots() will handle it correctly so long as the original data type is integer and not numeric:
ggplot() +
  aes(xdist = posterior::rvar(activity_2mins$active_bins)) +
  stat_dots(quantiles = 100)
Other solutions to large count data
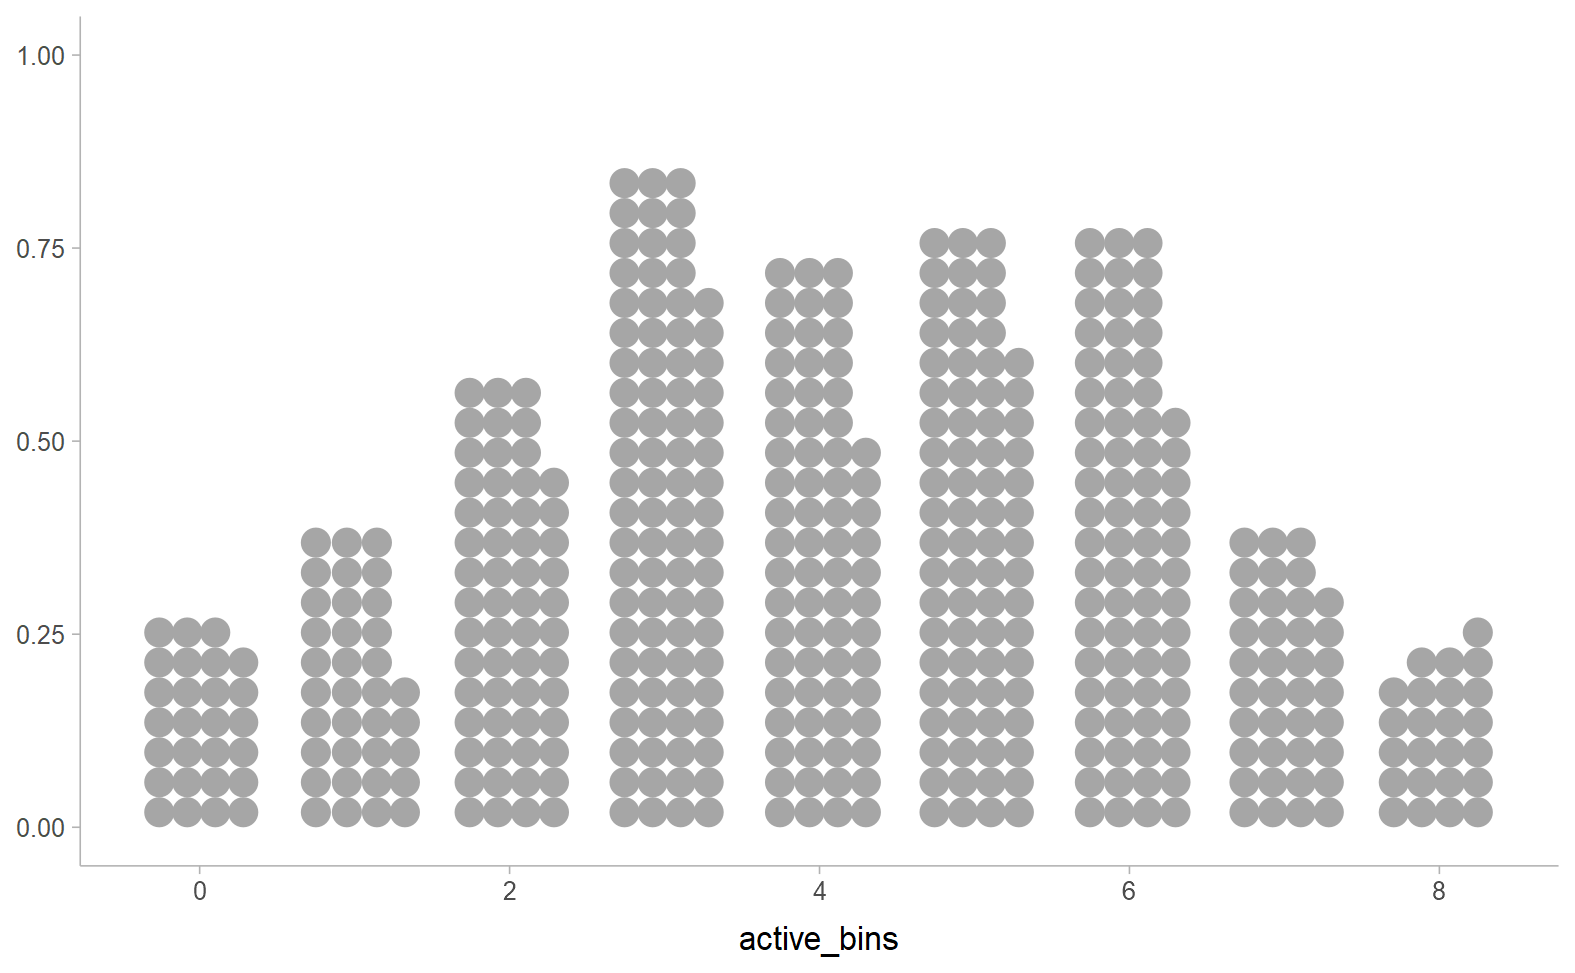
The new dotplot smoothing (in dev version) could also help here, by allowing you to plot all the dots without needing to summarize them to a smaller number using smooth = "discrete" or smooth = "bar". e.g.:
ggplot(activity_2mins, aes(x = active_bins)) +
  geom_dots(smooth = "bar")
Does that help? If that addresses everything here (except centering/aligning bins, which is in #101), I might close this.
As this closed issue has the relevant examples, I ask here. I get the above examples, but not if I want to use also group as in aes(*, group=treatment). I can make it work with the factor approach and facet_wrap, but not with rvar approach. @mjskay do you have a solution for this, too?