diagrams
 diagrams copied to clipboard
Is it possible to control Clusters arrangement, from left to right or top down?
Is it possible to control Clusters arrangement, from left to right or top-down for example? How?
Cluster class also has direction options, but it does not work. So I left a comment on why that does not work.
__init__.py
199: # FIXME:
200:     #  Cluster direction does not work now. Graphviz couldn't render
201:     #  correctly for a subgraph that has a different rank direction.
As the comment says, it is not supported (or impossible?) now because the Graphviz issue.
HI @mingrammer , awesome work with the tool.. Loving it totally. The Direction on the Clusters would have been very useful. Any idea any way this could be solved?
As we know, Graphviz can not set a new direction (layout) in sub-rank items. Is it possible to create a sub-graph (only the Cluster) first and then put it (as image file) back to the global graph (the original Diagram)?
If we change Cluster, and render cluster to a temp svg,
then we can use Custom with the temp one.
I made a demo and output like bellow:

With this solution, we can use different layout on cluster; link cluster as node.
But this solution comes with a serious drawback - edge CAN NOT link any node included in the cluster (of course).
So we must do a choice
- link node in cluster or
- link only the whole cluster for each cluster define.
Furthermore, more temp files generated, and the direction is a side-effect, not the major motivation
# Diagrams code demo
# Mention: I forked a version, so the code can not work in others.

with Diagram("Demo", show=False, direction="LR", filename="test", outformat='png'):

    parser = Compute('Parser & Analysis')

    with Cluster('object1',direction='LR') as cls1:
        objects = [
            Android(''),
            InternetOfThings('')
        ]

    with Cluster('object2',direction='TB') as cls2:
        objects2 = [
            Android(''),
            InternetOfThings('')
        ]

    parser - cls1
    parser >> cls1
    cls1 - cls2
    cls1 >> cls2 >> cls1

    # sorry, we can not
    # parser >> objects2
This is a critical feature, without this some diagrams come out badly laid out, eg:
https://github.com/HariSekhon/Diagrams-as-Code/blob/master/opentsdb_kubernetes_hbase.py
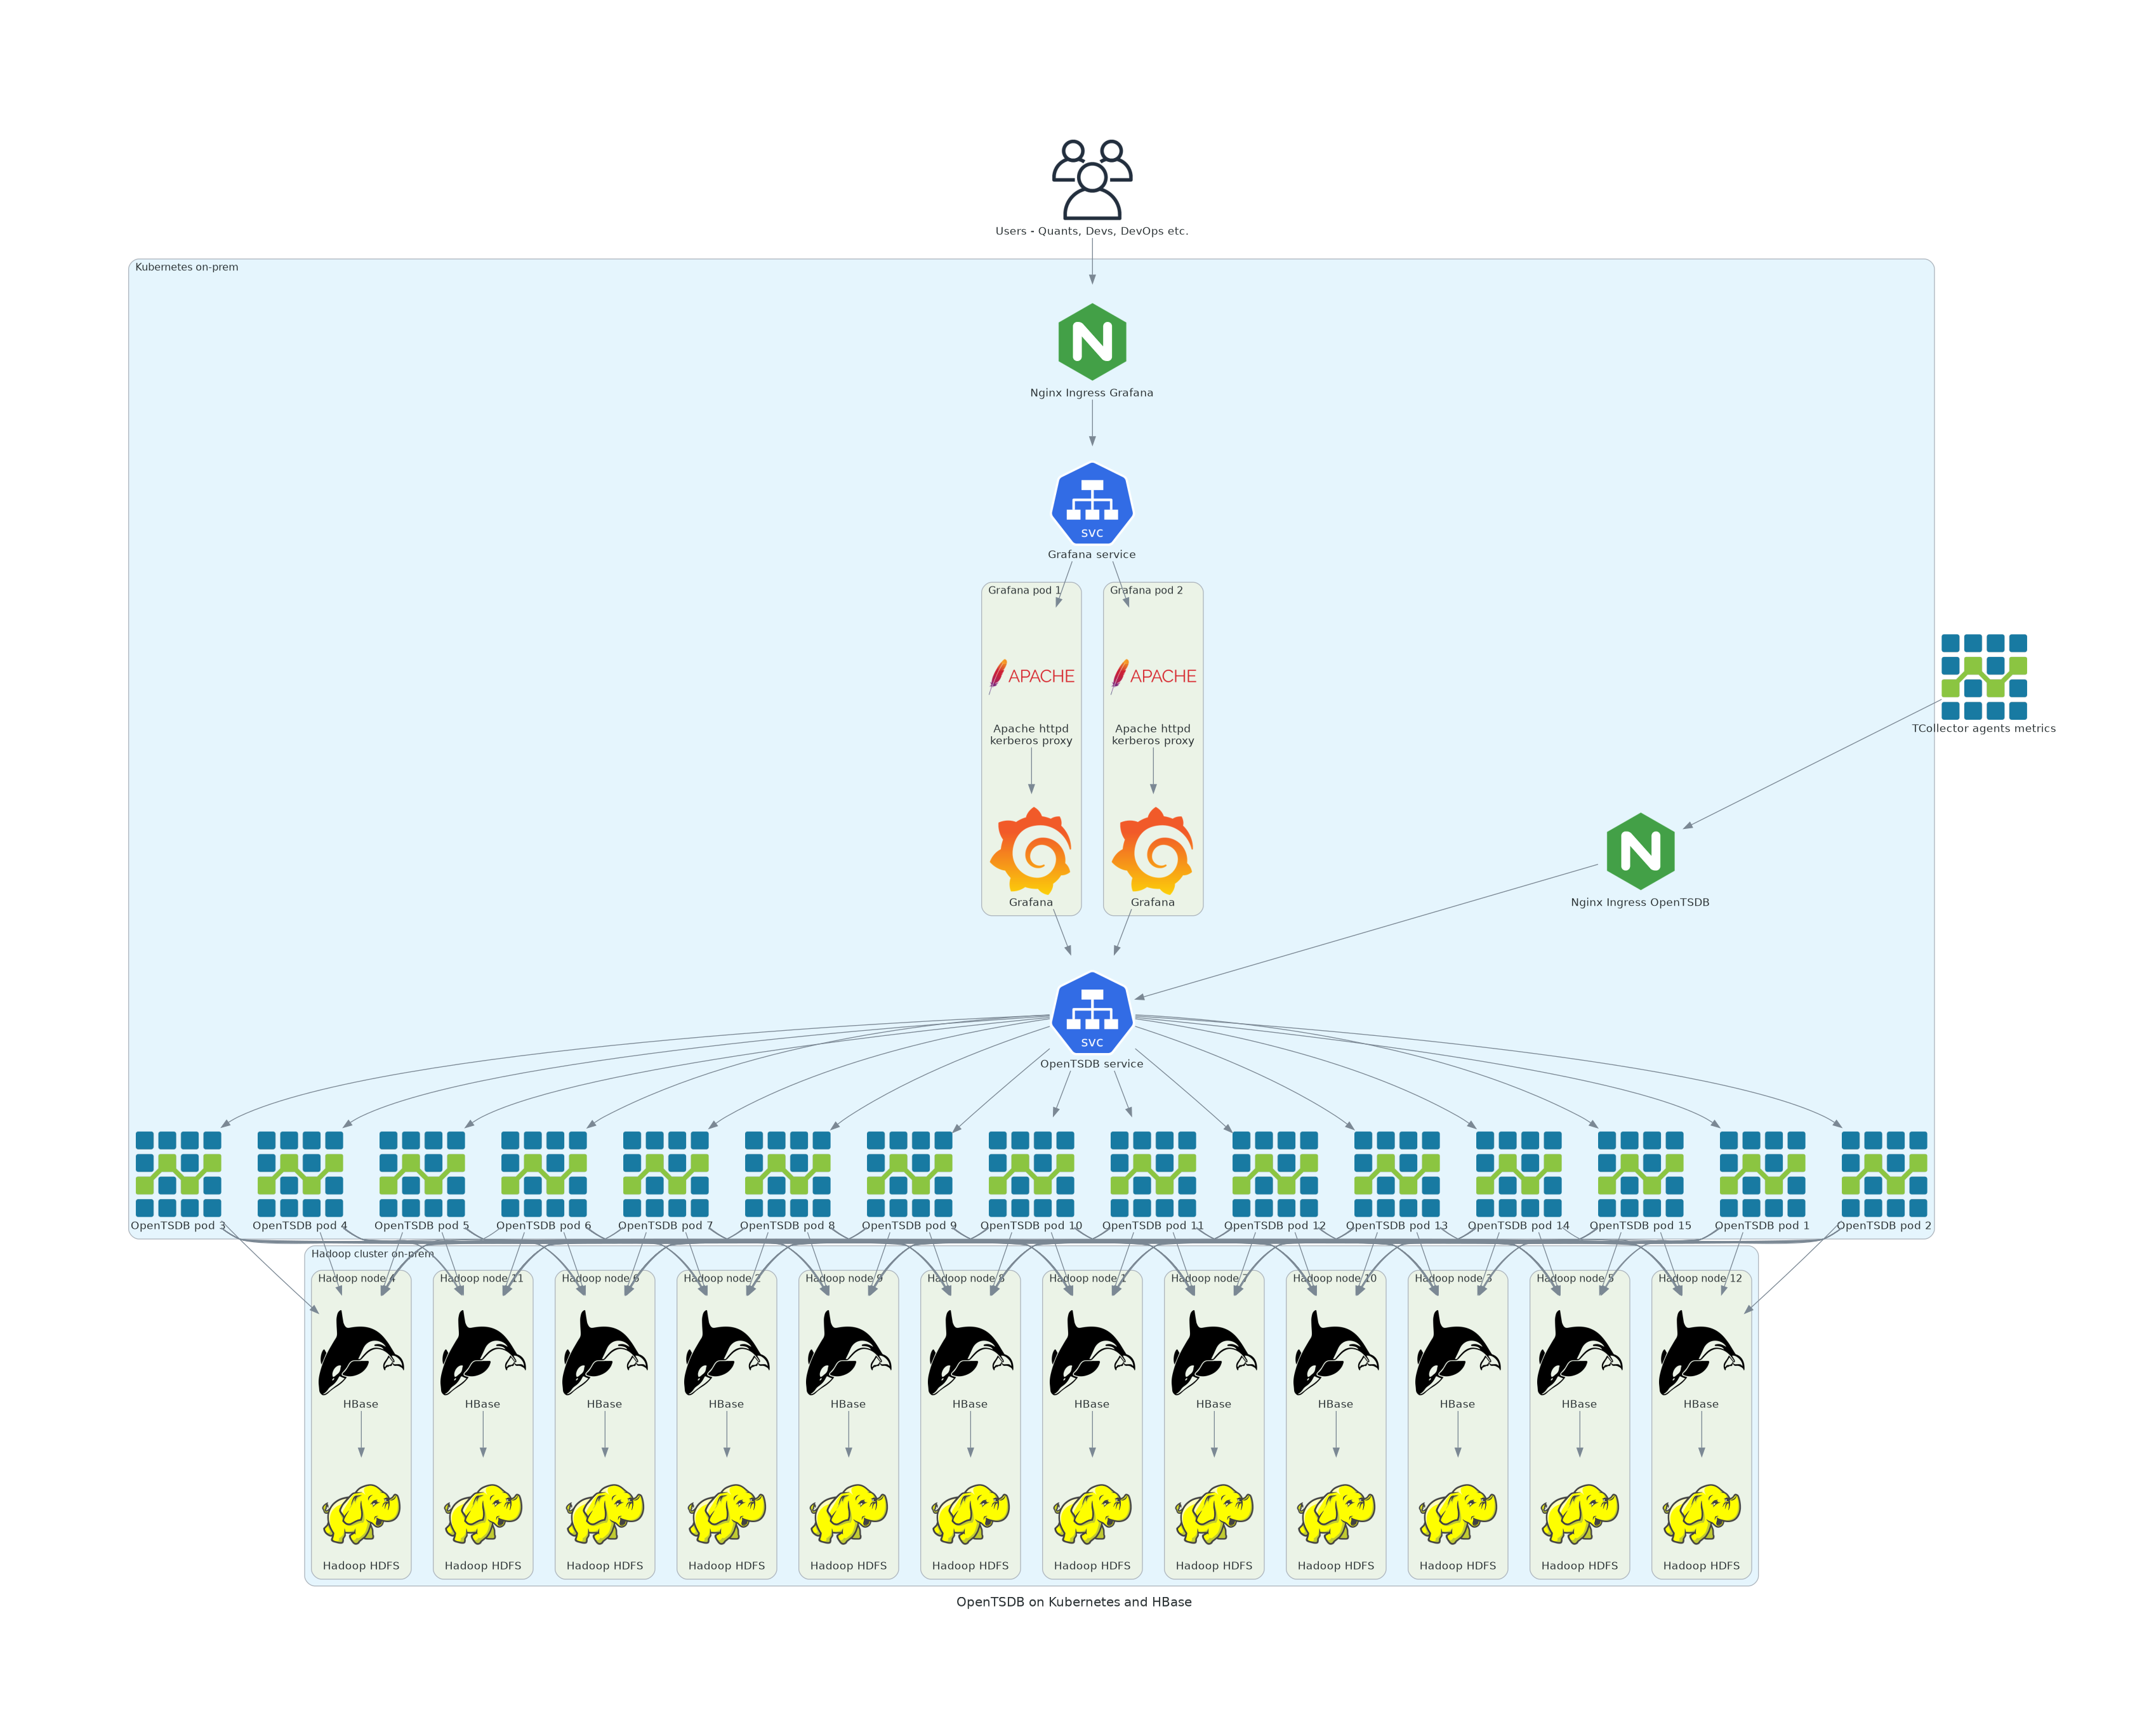
When this should clearly be stacked on top of each other rather than this awkward side-by-side layout.