vscode-java-debug
 vscode-java-debug copied to clipboard
Published
20 hours ago •
 microsoft
show call stacks more friendly
trafficstars
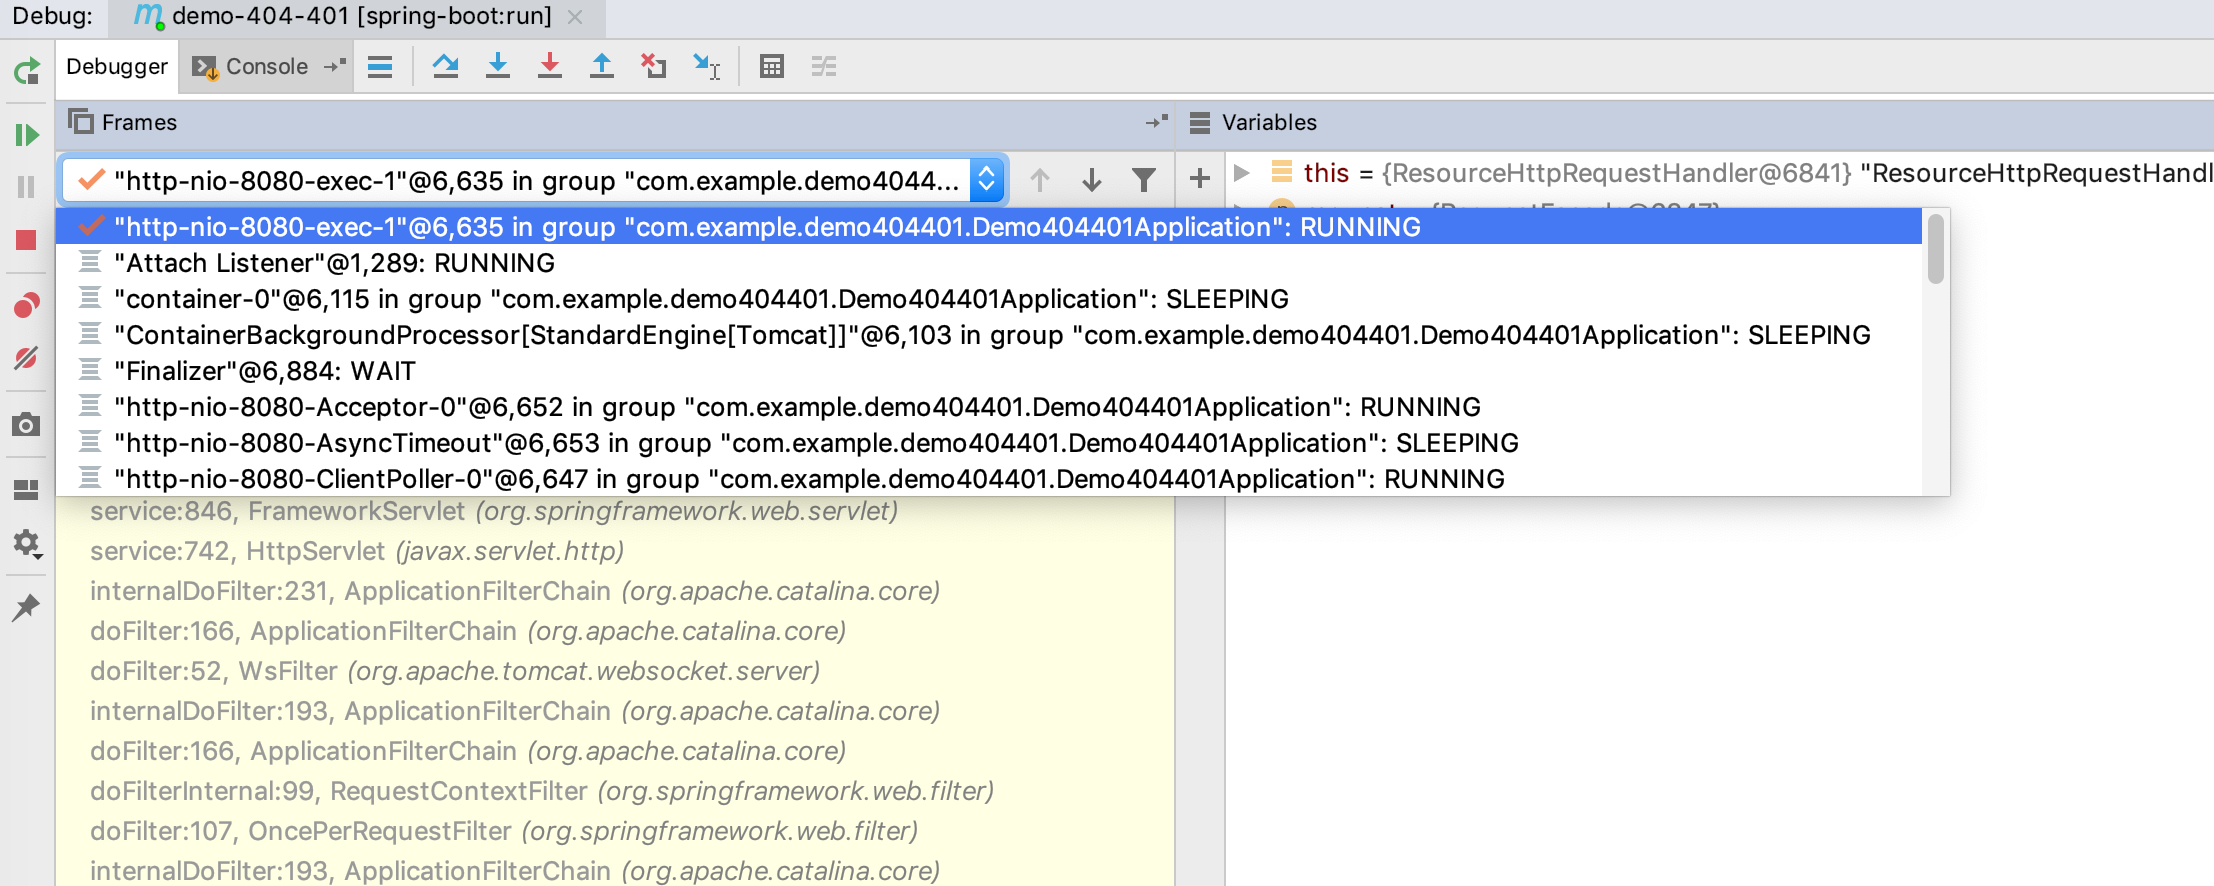
While debugging, the call stack panel list all of the threads:

But most of the threads are not related to the application; they are just builtin threads(Finalizer, most of http-nio-808-exec-*).
So, why not just put threads into a drop-down box?
When I select the current thread, show call stack of the current thread, and the UI will be more efficient:
This is involved with the vscode experience, oops. I'd suggest to move it to vscode repository for further discussion.