responsible-ai-toolbox
 responsible-ai-toolbox copied to clipboard
Error Explorer blank screen
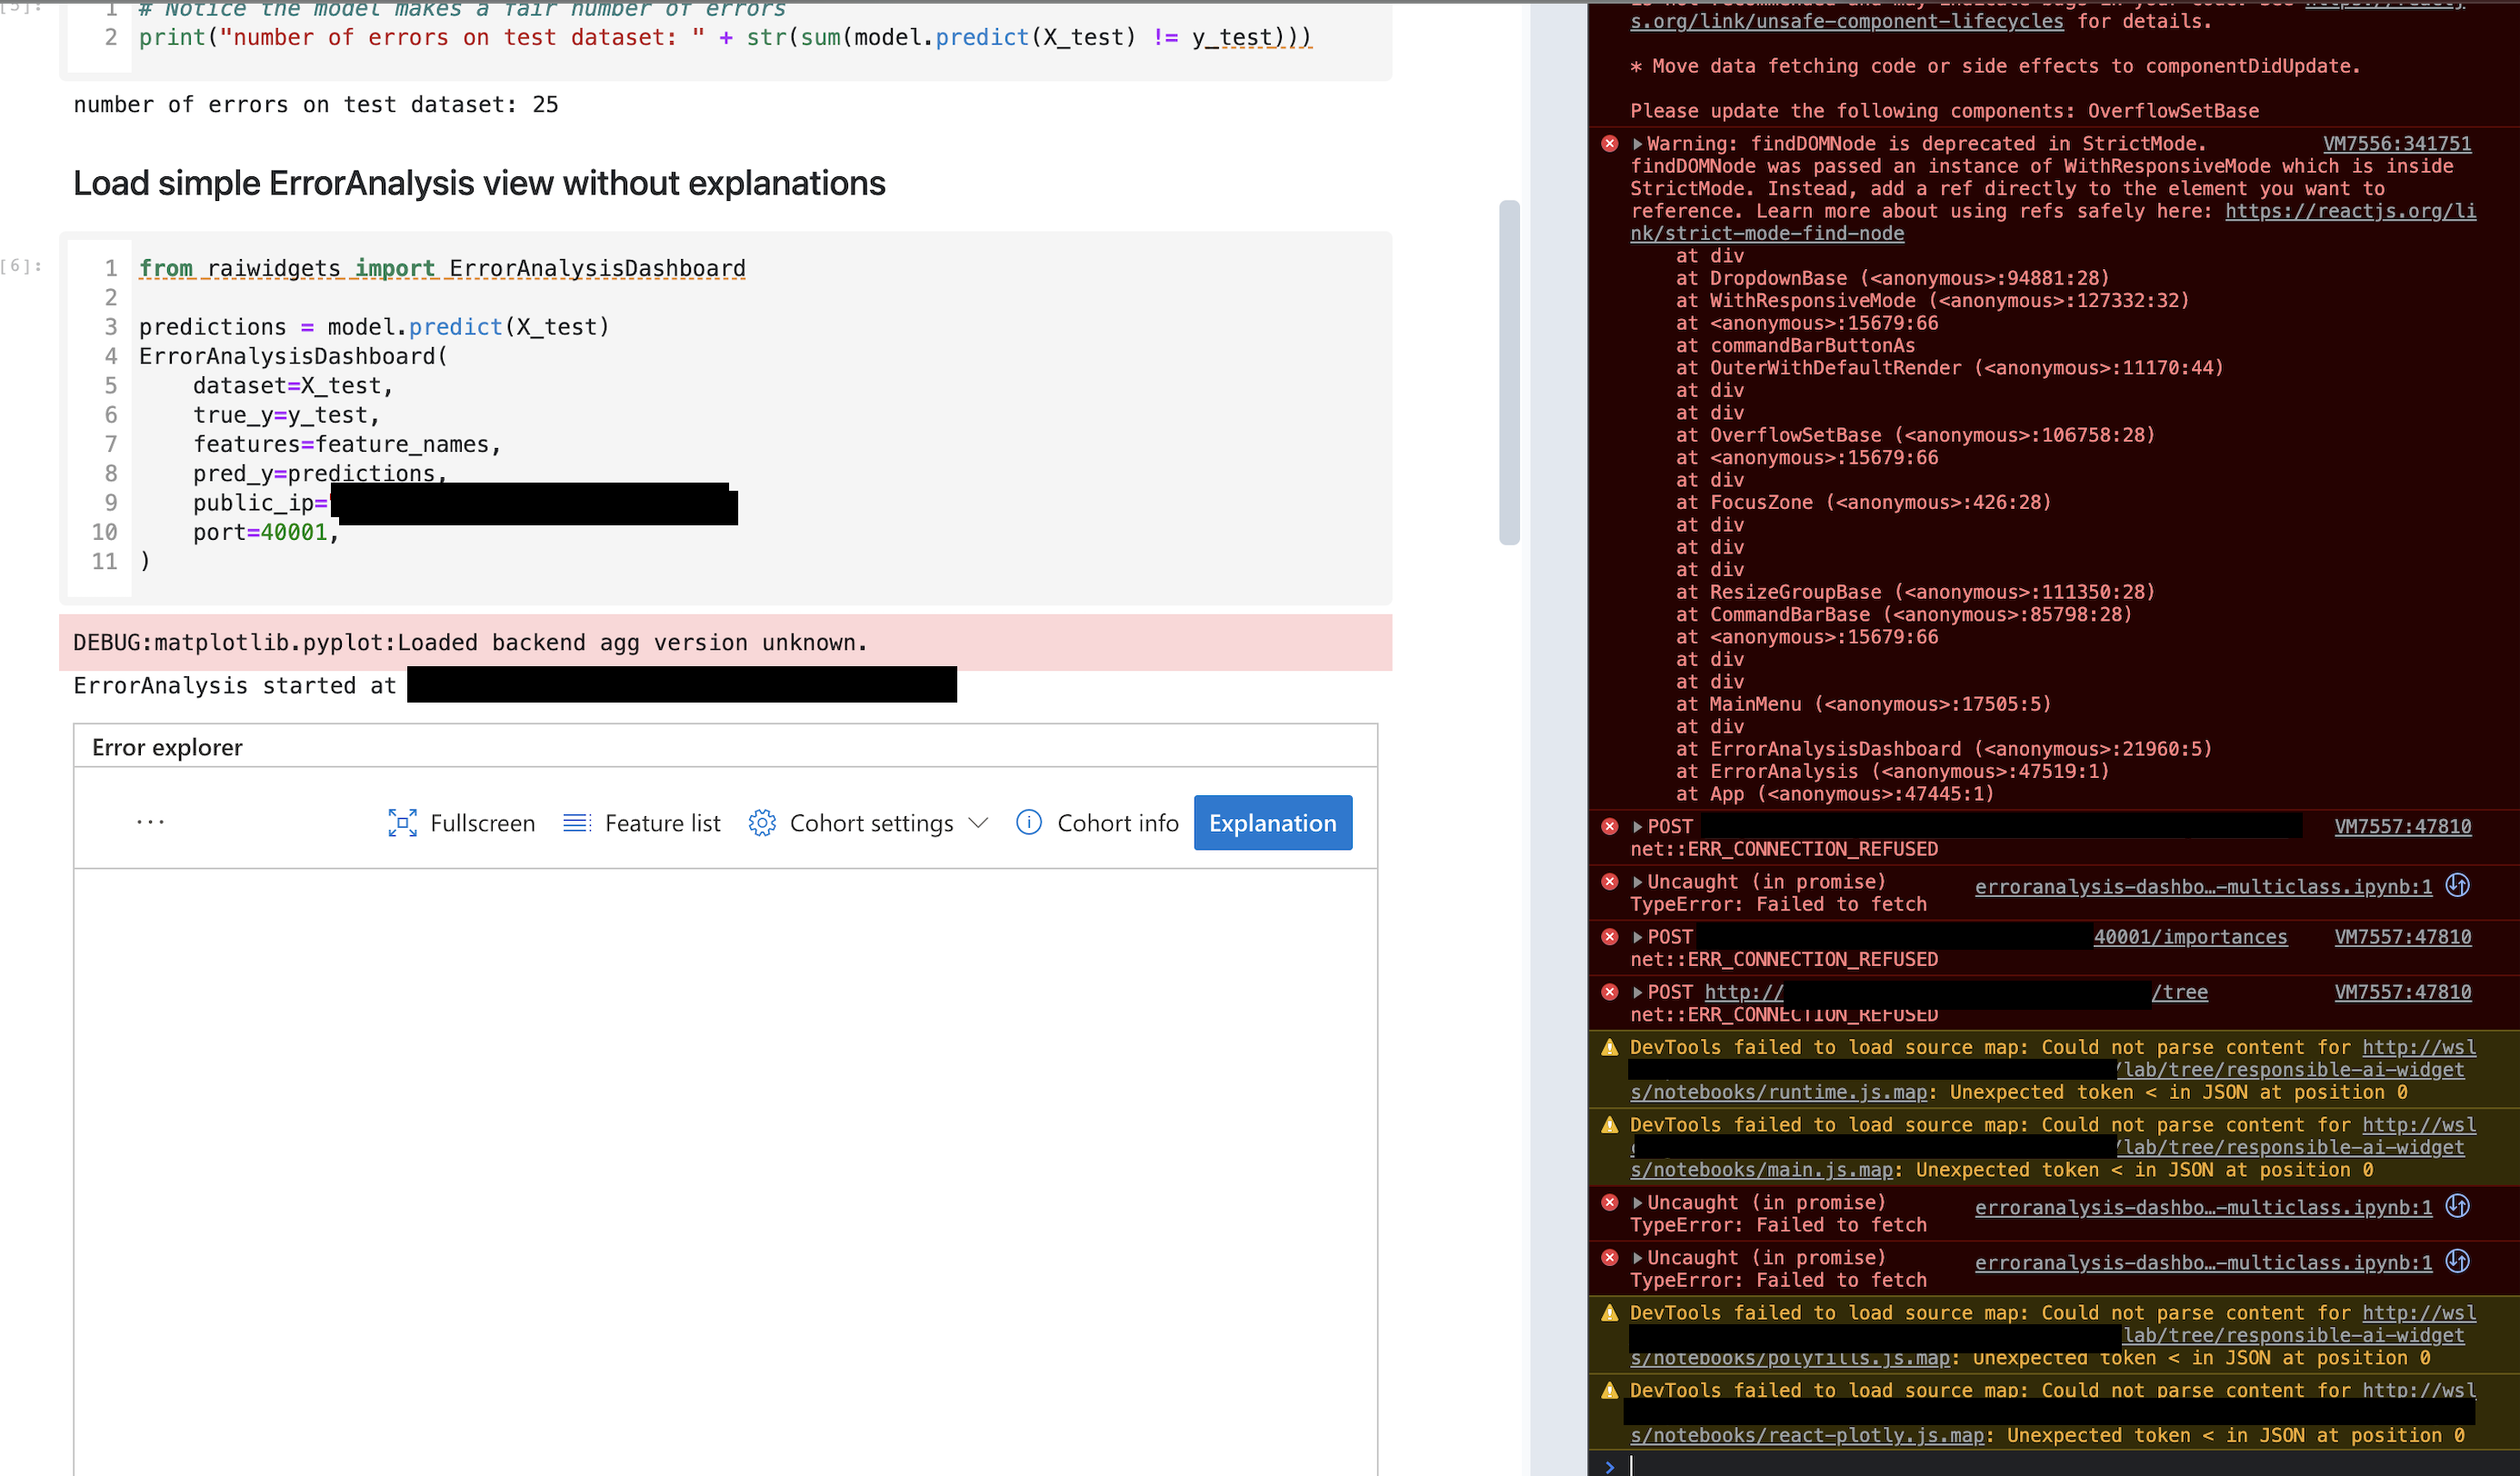
Running the latest version on Jupyterhub as an LDAP logged in user, the ErrorAnalysisDashboard gives a black screen. Attempting to open it in a separate tab also doesn't show anything:
It did work for a while but then suddenly not. I tested it without using jupyterhub or LDAP (ie just regular jupyter notebook as a linux user). Same issue.
It might be worth mentioning that disabling the firewall on the server doesn't fix the issue either
@marcelned based on the errors in browser it seems the error analysis dashboard UX is not able to make requests to the flask service. Are you sure you have opened that 40001 port on the VM and you have the right public IP address? If you open the notebook in fullscreen mode do you still see this issue and do you get similar errors? Edit: "Attempting to open it in a separate tab also doesn't show anything" oh it seems not :slightly_frowning_face:. It looks like the HTML loaded fine but the issue is calling the flask service to get the importances, train the tree, create heatmap, etc.
This seems like a networking issue and you've already used the debug console to see that the request is not getting through to the VM. Maybe one thing you can do is run jupyter on that port and see if you can access it from the public ip address. If you can, then that suggests something else might be happening. But if you can't, then probably you need to modify your VM firewall setting to allow that port - or perhaps you are passing in the wrong public ip address. If you are stuck we can have a call and you can share screen, I can try to help you out, but I'm not sure how far I can get since I don't control your network settings. Where did you get this VM from, is it from a private network or cloud? Are you using Azure or AWS or something else? What are the port settings currently, and what does the port settings page look like?
This is not even a VM but a bare metal server. The machine's firewall settings have been all shut down so it can' be that.
I tested basic flask server on the same ports and I can access said apps. So it can't be a networking issue.
Is there a way to more verbosely print the logs of the application?
@marcelned sorry I'm not sure how to fix the issue based on the current information. I see that the connection was refused here, so it seems that the requests are not getting to the flask service:
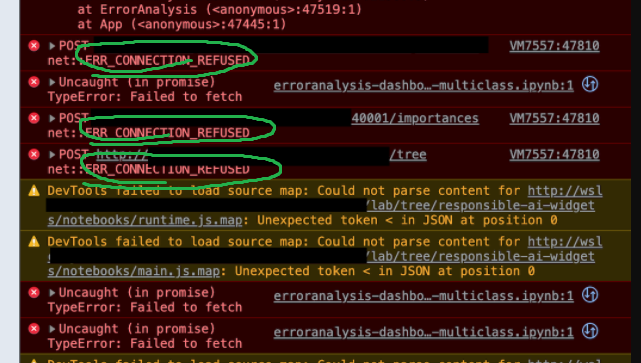 I think if you click on the links there it might give more information on why the call was refused from the browser.
Perhaps we might be able to debug over a Teams/
I think if you click on the links there it might give more information on why the call was refused from the browser.
Perhaps we might be able to debug over a Teams/