presidio

presidio copied to clipboard
Memory is not released
Describe the bug The longer the running time, the higher the memory footprint.
To Reproduce Steps to reproduce the behavior:
- Create a analyzer
analyzer = AnalyzerEngine(nlp_engine=NLP_Engine, supported_languages=['zh']) - Any text information used for testing. The longer the text message, the better
- View memory after every 100 analyses. Expected behavior GC.
Screenshots
Additional context
def func():
configuration = {'nlp_engine_name': 'stanza', 'models': [{'lang_code': 'zh', 'model_name': 'zh'}]}
engine = NlpEngineProvider(nlp_configuration=configuration).create_engine()
analyzer = AnalyzerEngine(nlp_engine=engine, supported_languages=['zh'])
text = 'Any text information used for testing. The longer the text message, the better'
for _ in range(100):
for _ in range(100):
analyzer.analyze(text, 'zh')
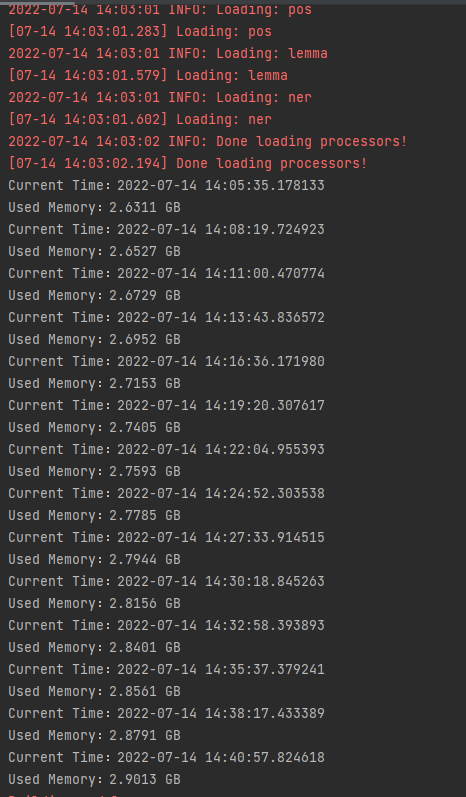
print(f'Current Time:{datetime.now()}')
print(u'Used Memory:%.4f GB' % (psutil.Process(os.getpid()).memory_info().rss / 1024 / 1024 / 1024))
Current Time:2022-07-14 14:05:35.178133
Used Memory:2.6311 GB
Current Time:2022-07-14 14:08:19.724923
Used Memory:2.6527 GB
Current Time:2022-07-14 14:11:00.470774
Used Memory:2.6729 GB
Current Time:2022-07-14 14:13:43.836572
Used Memory:2.6952 GB
Current Time:2022-07-14 14:16:36.171980
Used Memory:2.7153 GB
Current Time:2022-07-14 14:19:20.307617
Used Memory:2.7405 GB
Current Time:2022-07-14 14:22:04.955393
Used Memory:2.7593 GB
Current Time:2022-07-14 14:24:52.303538
Used Memory:2.7785 GB
Current Time:2022-07-14 14:27:33.914515
Used Memory:2.7944 GB
Current Time:2022-07-14 14:30:18.845263
Used Memory:2.8156 GB
Current Time:2022-07-14 14:32:58.393893
Used Memory:2.8401 GB
Current Time:2022-07-14 14:35:37.379241
Used Memory:2.8561 GB
Current Time:2022-07-14 14:38:17.433389
Used Memory:2.8791 GB```.
Thanks. I wonder if this issue happens when you call stanza directly in the same way. Have you tested it by any chance?