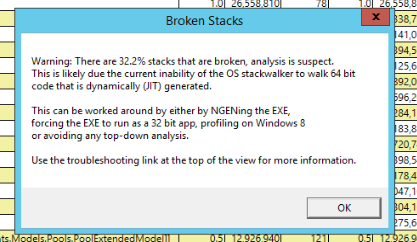
Stacks broken, analysis is suspect
I am not sure why I am getting this message or what the solution is in the popup actually does. Is there a reason why I am getting this on a 64 bit machine trying to profile a ASP.NET website?
@cblaze22, there are a range of reasons that this can happen. In general though, the data that you captured should still be usable. You may notice that some of the stacks are missing their bottom portions, but for the most part, this often isn't impactful to analysis.
Are you seeing this with .NET Framework or .NET Core, and can you share which version you're running? I am looking into an issue that might be present on .NET 6, but if this is any other version, it's likely unrelated to what I'm looking at.
Then this is not related to the issue that I'm in the process of tracking down. I'm not sure what would cause the issue. The message that you're getting is fairly old, and so I should remove it, but that doesn't change the fact that you have a bunch of stacks that aren't getting unwound by the OS unwinder all the way to the base of the stack. I'll do some follow-up to see if this is showing up anywhere else.
@eiriktsarpalis, on .NET 6, I believe this is an issue with respect to R2R images and unwind information. Adding @AntonLapounov, who is looking at this.
The same on latest .Net 6 Preview. As a consequence, it is impossible to trust the results :-( I think we will need PerfView in PowerShell repo for next two months to prepare next release based on .Net 6.0.
For .NET 6, this is being tracked with https://github.com/dotnet/runtime/issues/53743.
@OracPrime this occurs for a number of reasons. It looks like this bug has been used to track a couple of them. The most recent one (https://github.com/dotnet/runtime/issues/53743) has been fixed. The most common reasons that I've seen for this are binaries that don't properly expose their unwind data (unusual) and lost events (more common). The lost events case can usually be solved by re-capturing with an increased buffer size.
I'm going to close this issue because it's been used for a couple of different issues. If you're seeing this, please do open an new issue and we can try to help.
It turns out I was using BenchmarkDotNet and was looking at the top level .exe with perfview. It turns out it spawns a dotnet process, and if I look at that one (which is where the data I am interested in is) then the stacks are fine. So my concerns have gone away. Thanks for the feedback.