perfview
 perfview copied to clipboard
PerfView is a CPU and memory performance-analysis tool
This issue is copied from our internal planning OneNote for tracking purposes. I will add more information here when I get more clarity on what we want to do here.

I wanted to use the relogger to gather all events that occur within a certain start/stop time in a trace and then write that to a new etl file. What...
anyone can help a perfview installation question? while following the doc to install the perfview on the pcf VM: https://github.com/microsoft/perfview/blob/main/src/perfcollect/perfcollect the installation was failed with: ===== ERROR: DKMS version is...
Contention/Start event has a new version in https://github.com/dotnet/runtime/pull/72627. This PR adds support for it.
Win 7 64 ``` TraceEventSession traceEventSession = new TraceEventSession(KernelTraceEventParser.KernelSessionName); traceEventSession.EnableKernelProvider(KernelTraceEventParser.Keywords.NetworkTCPIP); ``` System.ComponentModel.Win32Exception:“The specified module could not be found” I have installed visual c++ redistributable 2019 I tried version 3.0.2 and...
the runtime change [#55888](https://github.com/dotnet/runtime/pull/55888) added a bunch of new events for GC analysis. corresponding changes need to happen in perfview.
Improve (for the next release of TraceEvent) the error handling in Microsoft.Diagnostics.Tracing.ZippedETLWriterGetNGenPdbs. It could catch any exception and add it to the log.
This also eliminates a warning from the IDE when you load PerfView.sln on a machine without the .NET Core 2.1 runtime
I've tried to open Thread Time Stacks section on collected .etl file and got crash. Visual Studio shows System.StackOverflowException 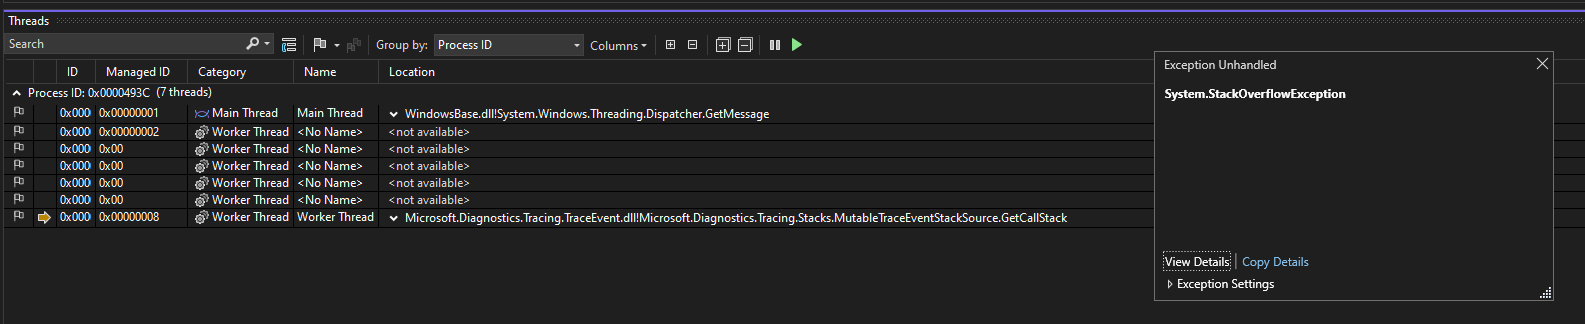 I'm not sure how to send files. I would prefer...