Feature Request: --extendedDiagnostics option to save as JSON
Suggestion
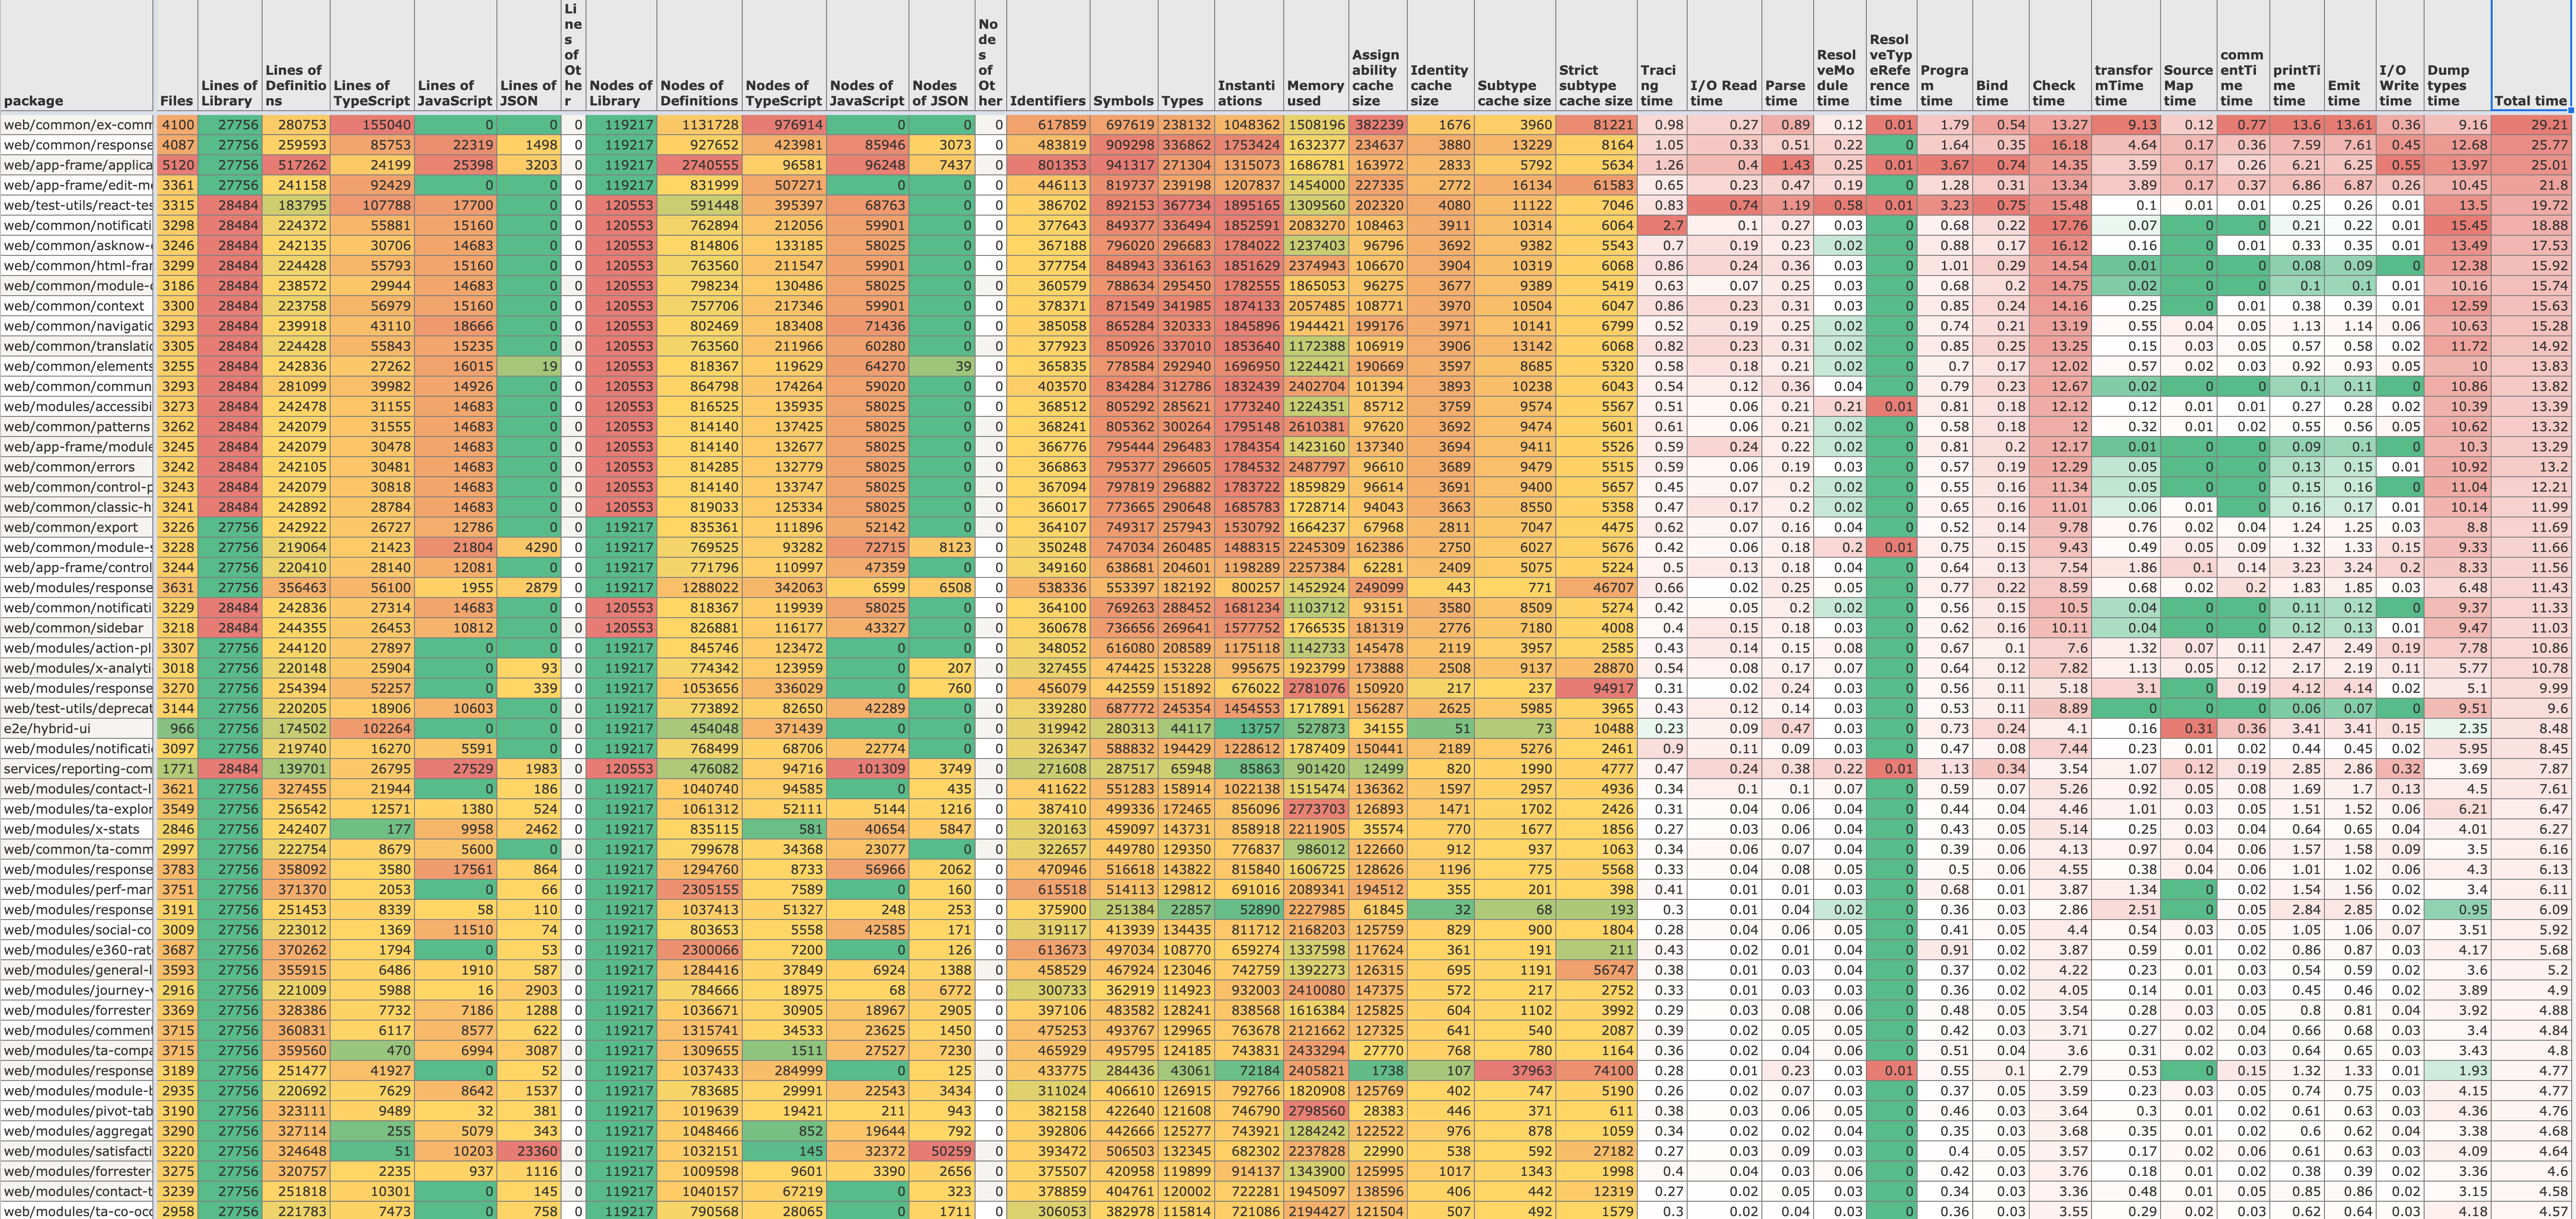
The extended diagnostics information is helpful, but overwhelming in enterprise monorepos with hundreds of packages. It's not sortable or easily human grokable.
If the data was in JSON we can easily import it into a spreadsheet and sort it, look for patterns.
Example, sorted by Total time:
🔍 Search Terms
- extended diagnostics
- JSON output
- performance issues
- slow compile time
✅ Viability Checklist
My suggestion meets these guidelines:
- [X] This wouldn't be a breaking change in existing TypeScript/JavaScript code
- [X] This wouldn't change the runtime behavior of existing JavaScript code
- [X] This could be implemented without emitting different JS based on the types of the expressions
- [X] This isn't a runtime feature (e.g. library functionality, non-ECMAScript syntax with JavaScript output, new syntax sugar for JS, etc.)
- [X] This feature would agree with the rest of TypeScript's Design Goals.
⭐ Suggestion
Ideally, all of the JSON is written into one file, even when --build is building multiple projects.
--extendedDiagnostics ts-build-data.json
Importantly, something like program.getCompilerOptions().rootDir should be added to the diagnostics output so it's clear which project each group of data belongs to.
The data should look something like this:
[
  {
    "Project": "packages/project-directory",
    "Files": 295,
    "Lines of Library": 27756,
    "Lines of Definitions": 48357,
    "Lines of TypeScript": 9150,
    "Lines of JavaScript": 0,
    "Lines of JSON": 0,
    "Lines of Other": 0,
    "Nodes of Library": 119217,
    "Nodes of Definitions": 129624,
    "Nodes of TypeScript": 34714,
    "Nodes of JavaScript": 0,
    "Nodes of JSON": 0,
    "Nodes of Other": 0,
    "Identifiers": 99837,
    "Symbols": 64570,
    "Types": 5182,
    "Instantiations": 1421,
    "Memory used": 149497,
    "Assignability cache size": 25,
    "Identity cache size": 0,
    "Subtype cache size": 0,
    "Strict subtype cache size": 0,
    "Tracing time": 0.09,
    "I/O Read time": 0.05,
    "Parse time": 0.78,
    "ResolveModule time": 0.08,
    "ResolveTypeReference time": 0,
    "Program time": 1.07,
    "Bind time": 0.46,
    "Check time": 0.33,
    "transformTime time": 0.19,
    "Source Map time": 0.01,
    "commentTime time": 0.06,
    "printTime time": 0.51,
    "Emit time": 0.52,
    "I/O Write time": 0.01,
    "Dump types time": 0.38,
    "Total time": 2.38
  },
 ...rest of projects
]
- The project directory should be the first value. This is helpful when pasting into a spreadsheet.
- The numbers could be
{ value, unit }, but that would make it more complicated for pasting into a spreadsheet.
I generated the spreadsheet used in the screenshots by outputting a JSON file here:
https://github.com/microsoft/TypeScript/blob/main/src/executeCommandLine/executeCommandLine.ts#L1136-L1153
const rootDir = program.getCompilerOptions().rootDir;

// We want `name` to be the key.
const data = Object.fromEntries(
  [
      ['rootDir', rootDir],
      ...statistics.map(({name, value}) => [name, parseFloat(value)])
  ]
);

// We need to read in what's in the file and then add to it. This is not ideal.
const previous = JSON.parse(sys.readFile(filename) || '[]');
sys.writeFile(filename, JSON.stringify([...previous, data], null, 2));
📃 Motivating Example
This is from an enterprise monorepo with more than 200 projects that takes about 30 minutes to tsc -b. We've already found multiple places to improve our code from this output.
💻 Use Cases
- Determine which packages are slowing down the build.
- Understand the impact of generated types and untyped JavaScript.
- Higher level but a good companion to https://github.com/microsoft/typescript-analyze-trace.