JS Runtime execution efficiency and sandboxing improvements
Performance items:
- [x] ~~Share runtime across execution contexts? Per-session?~~ (experiment: https://github.com/microsoft/CCF/pull/2162)
- [x] Investigate performance benefit from caching pre-compiled bytecode? Implemented in #2643.
Sandboxing/Fairness:
- [ ] Expose context memory limit to either governance or endpoint schema (JS_SetMemoryLimit)
- [ ] Add execution cap (JS_SetInterruptHandler)
For the limits, I would suggest to store global (not per-endpoint) settings. I don't think there's a good use case for per-endpoint settings and keeping it separate from the app deployment proposal (which would include per-endpoint metadata) makes it more visible. I suggest a new proposal set_js_engine_options with fields max_stack_size, max_heap_size, and max_execution_time.
EDIT: max_memory_size or memory_limit instead of max_heap_size may be more common, also since the error is typically "out of memory". I do prefer max_heap_size though.
+1 on the names.
I think there may eventually be a case for split values because I can imagine a scenario where public/quasi public-endpoints have lower limits than endpoints for which access is restricted to a small number of admin-like identities who occasionally need to run more expensive tasks (GC-like, analytics...). Right now though, a global limit is fine.
The interrupt handler set by JS_SetInterruptHandler is called (via js_poll_interrupts()) at the following points, mostly to avoid going into infinite loops/recursion without allowing "ctrl-c":
- function calls
instanceof- some opcodes: goto (for exceptions etc.), if_true, if_false
Given that, we could enforce a limit based roughly on number of function calls, but this would be a very weak guarantee. The alternative is to use untrusted time to measure execution time, which likely makes more sense. Any opinions?
As additional motivation for sharing runtime/context, we've recently seen a measurable drop in the ls_js_sgx_cft benchmark from a seemingly innocuous change - #2569:
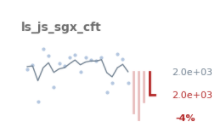
After further investigation, it turns out this is wholly from the increase in the size of the JS script, where this PR adds a few functions to the end. We can see a similar drop from anything that increases the size of the JS script, for instance adding a large string constant to the start:
let s = `Lorem ipsum <SNIP>`; // A 12K string
Local test throughput dropped from ~1.8kTPS to ~1.4kTPS.
We don't have any picobenchmarks of QuickJS interaction so don't have a more fine-grained explanation of the perf impact here, but it would presumably be removed if we could cache the app between invocations. However this likely requires caching the JSContext, which goes even further than the JSRuntime explored previously in this issue/test PR, and looks fundamentally unsound (maintains global JS state between invocations). The only way I see this working is if we could snapshot the JSContext after the app has been loaded but before anything has been invoked, and reuse this snapshot between invocations. JS_DupContext doesn't do that, its just a refcount increase where we're looking for a deep clone. We also still have the stack and threading issues described in #2162.
I had another look at this and can confirm that sharing runtimes is not enough because module loading/caching happens per-context, not per-runtime.
The docs of quickjs mention:
If the script or module was compiled to bytecode with qjsc, it can be evaluated by calling js_std_eval_binary(). The advantage is that no compilation is needed so it is faster and smaller because the compiler can be removed from the executable if no eval is required.
Looking at qjsc.c there is a function output_object_code() which uses JS_WriteObject() to dump the bytecode of a module, and quickjs-libc.c contains js_std_eval_binary() which uses JS_ReadObject() to read it in again. It may not be that hard after all and is worth a try.
Probably not useful for JS Apps long term, but applicable to governance, and so still worth doing.