ApplicationInsights-dotnet
 ApplicationInsights-dotnet copied to clipboard
Memory issue keeps coming back
- List of NuGet packages and version that you are using:
<PackageReference Include="Microsoft.ApplicationInsights.Kubernetes" Version="6.1.0" />
<PackageReference Include="Microsoft.ApplicationInsights.WorkerService" Version="2.21.0" />
- Runtime version (e.g. net461, net48, netcoreapp2.1, netcoreapp3.1, etc. You can find this information from the
*.csprojfile):
<TargetFramework>net7.0</TargetFramework>
- Hosting environment (e.g. Azure Web App, App Service on Linux, Windows, Ubuntu, etc.):
aks linux
Describe the bug
Memory keep increasing for no reason
 Without AppInsight
 with AppInsight
To Reproduce
- Create worker application
- Deploy it to kubernetes
- Simply watch and see the memory increasing
//In the past disabling those modules makes memory normal
//Now another thing (module?) increase the memory usage of the application even that application simply doing nothing
services.AddApplicationInsightsTelemetryWorkerService(new Microsoft.ApplicationInsights.WorkerService.ApplicationInsightsServiceOptions()
                {
                    ConnectionString = connectionString,
                    EnableAdaptiveSampling = false,
                    EnableEventCounterCollectionModule = false,
                    EnablePerformanceCounterCollectionModule = false,
                    DeveloperMode = false
                });
This is not the first time and i dont think it will be the last time Should I aggressively disabling more module?
Would it be possible for you to share a minimal repro app? I also suggest removing "Microsoft.ApplicationInsights.Kubernetes", as that package is not maintained in this repo. Without seeing the repro code, its hard to conclude anything.
Alternatively, file a support ticket (https://github.com/microsoft/ApplicationInsights-dotnet#support), and would need dumps to check what is taking up the memory.
//In the past disabling those modules makes memory normal
I am not aware of any memory issues with the components shown. Any links to other issues which suggested disabling these modules?
I cant find the exact recommendation but I recall facing this memory issue, apply recommended configuration as what the documentation said and then the memory looks normal but if i recall it again, the memory was normal because the connection string was not using the latest connection string format thus it is not showing in live metric

https://learn.microsoft.com/en-us/azure/azure-monitor/app/asp-net-core?tabs=netcorenew%2Cnetcore6
Now I have all configuration correct, the application showing in live metric
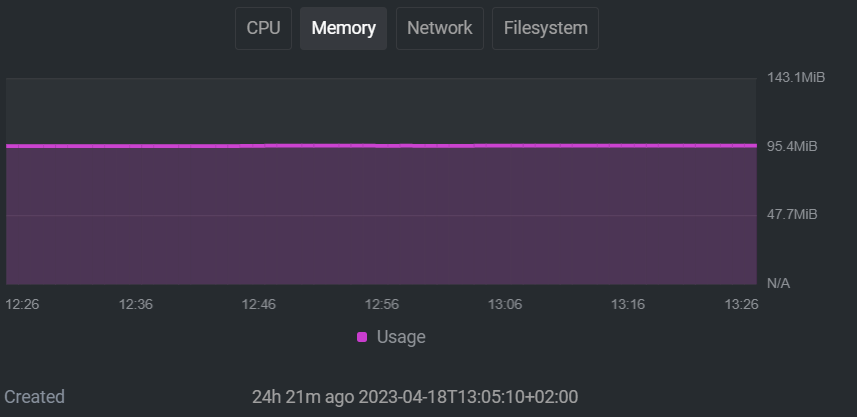
memory seems stabilize in that line but ofcourse the one without app insight also stable with 75% less memory
I will try to get the dotnet-dump if that will help?