VISIO drawing not working properly
Hi. I ran this script in 2 different tenants. Tenant1: it had a few services/objects (only 19 resources), created excel file and drew the visio file perfectly - all services there. Tenant2: it had 484 services/objects, created the excel file but the visio file only showed express route and 1 wan connection. Nothing else was show. I ran it from the same Windows machine, same software versions (same as yours). Any thoughts?
Tenant1:

Tenant2:

Hi,
We are still figuring how to properly represent vWAN in the diagram. That's why the vWAN itself is "empty", the script is basically skipping it, By the way I suppose this Express Route is connected with this vWAN right?
I believe that might be the error.
Since you are using vWAN, can you detail to us how is your network topology is designed?
Hi Claudio, thanks for the quick reply. Yes, you assume right. The vWan connects the express route in one end, and also connects to a virtual hub on a hub-spoke topology, with an azure firewall deployed as default route for all vnets (peering only between each vnet and the hub subnet).
Rgs.,
Hi guys. Any news on this? Related to VWAN. I still cannot have the design, only excel with details. Thanks.
Hi,
We are working in the version 2.2 of the script, we expect to have some update in this issue with the diagram.
The problem is that VWAN relays in several internal resources that are not open to be extracted by Resource Graph, so we are trying to workaround that.
Hi,
We are working in the version 2.2 of the script, we expect to have some update in this issue with the diagram.
The problem is that VWAN relays in several internal resources that are not open to be extracted by Resource Graph, so we are trying to workaround that.
Thank you for such quick reply, Claudio. Just want to say itis a fantastic work you guys are doing! Rgs.,
Helder
Hello,
Version 2.2.0 is alive, and now it supports the vWAN diagram in Draw.io.
Can you give it a try and tell us if worked?
Thanks
Hey Claudio, Just did. The excel file was perfect, once again. The drawing has issues. I have 1 subscription only, 2 datacenters (east, west). They both have hubs. On West (DR), I have a hub, a few subnets, app gw, express route. They were all there. On East I have a hub, p2s and s2s vpn, ExpressRoute, az Firewall, lots of subnets. But It only showed ER, P2S and S2S VPNs. It did not show Az Firewall or any of the internal subnets. Do I need to add any specific permissions from my machine (I´m going thru powershell, internet, not connected to the remote network) to go thru Az Firewall to collect that data? Or should it be shown as well? I am subscription owner. Let me know so I can run some other tests. Thank you for creating such a fantastic tool.
Rgs.,
Helder
Hi,
Can you post a picture of how the drawing for the east region was?
I was trying to figure what went wrong by analyzing the code, but seeing the image I think will be easier to understand where the error was.
Thanks
Hey Claudio.
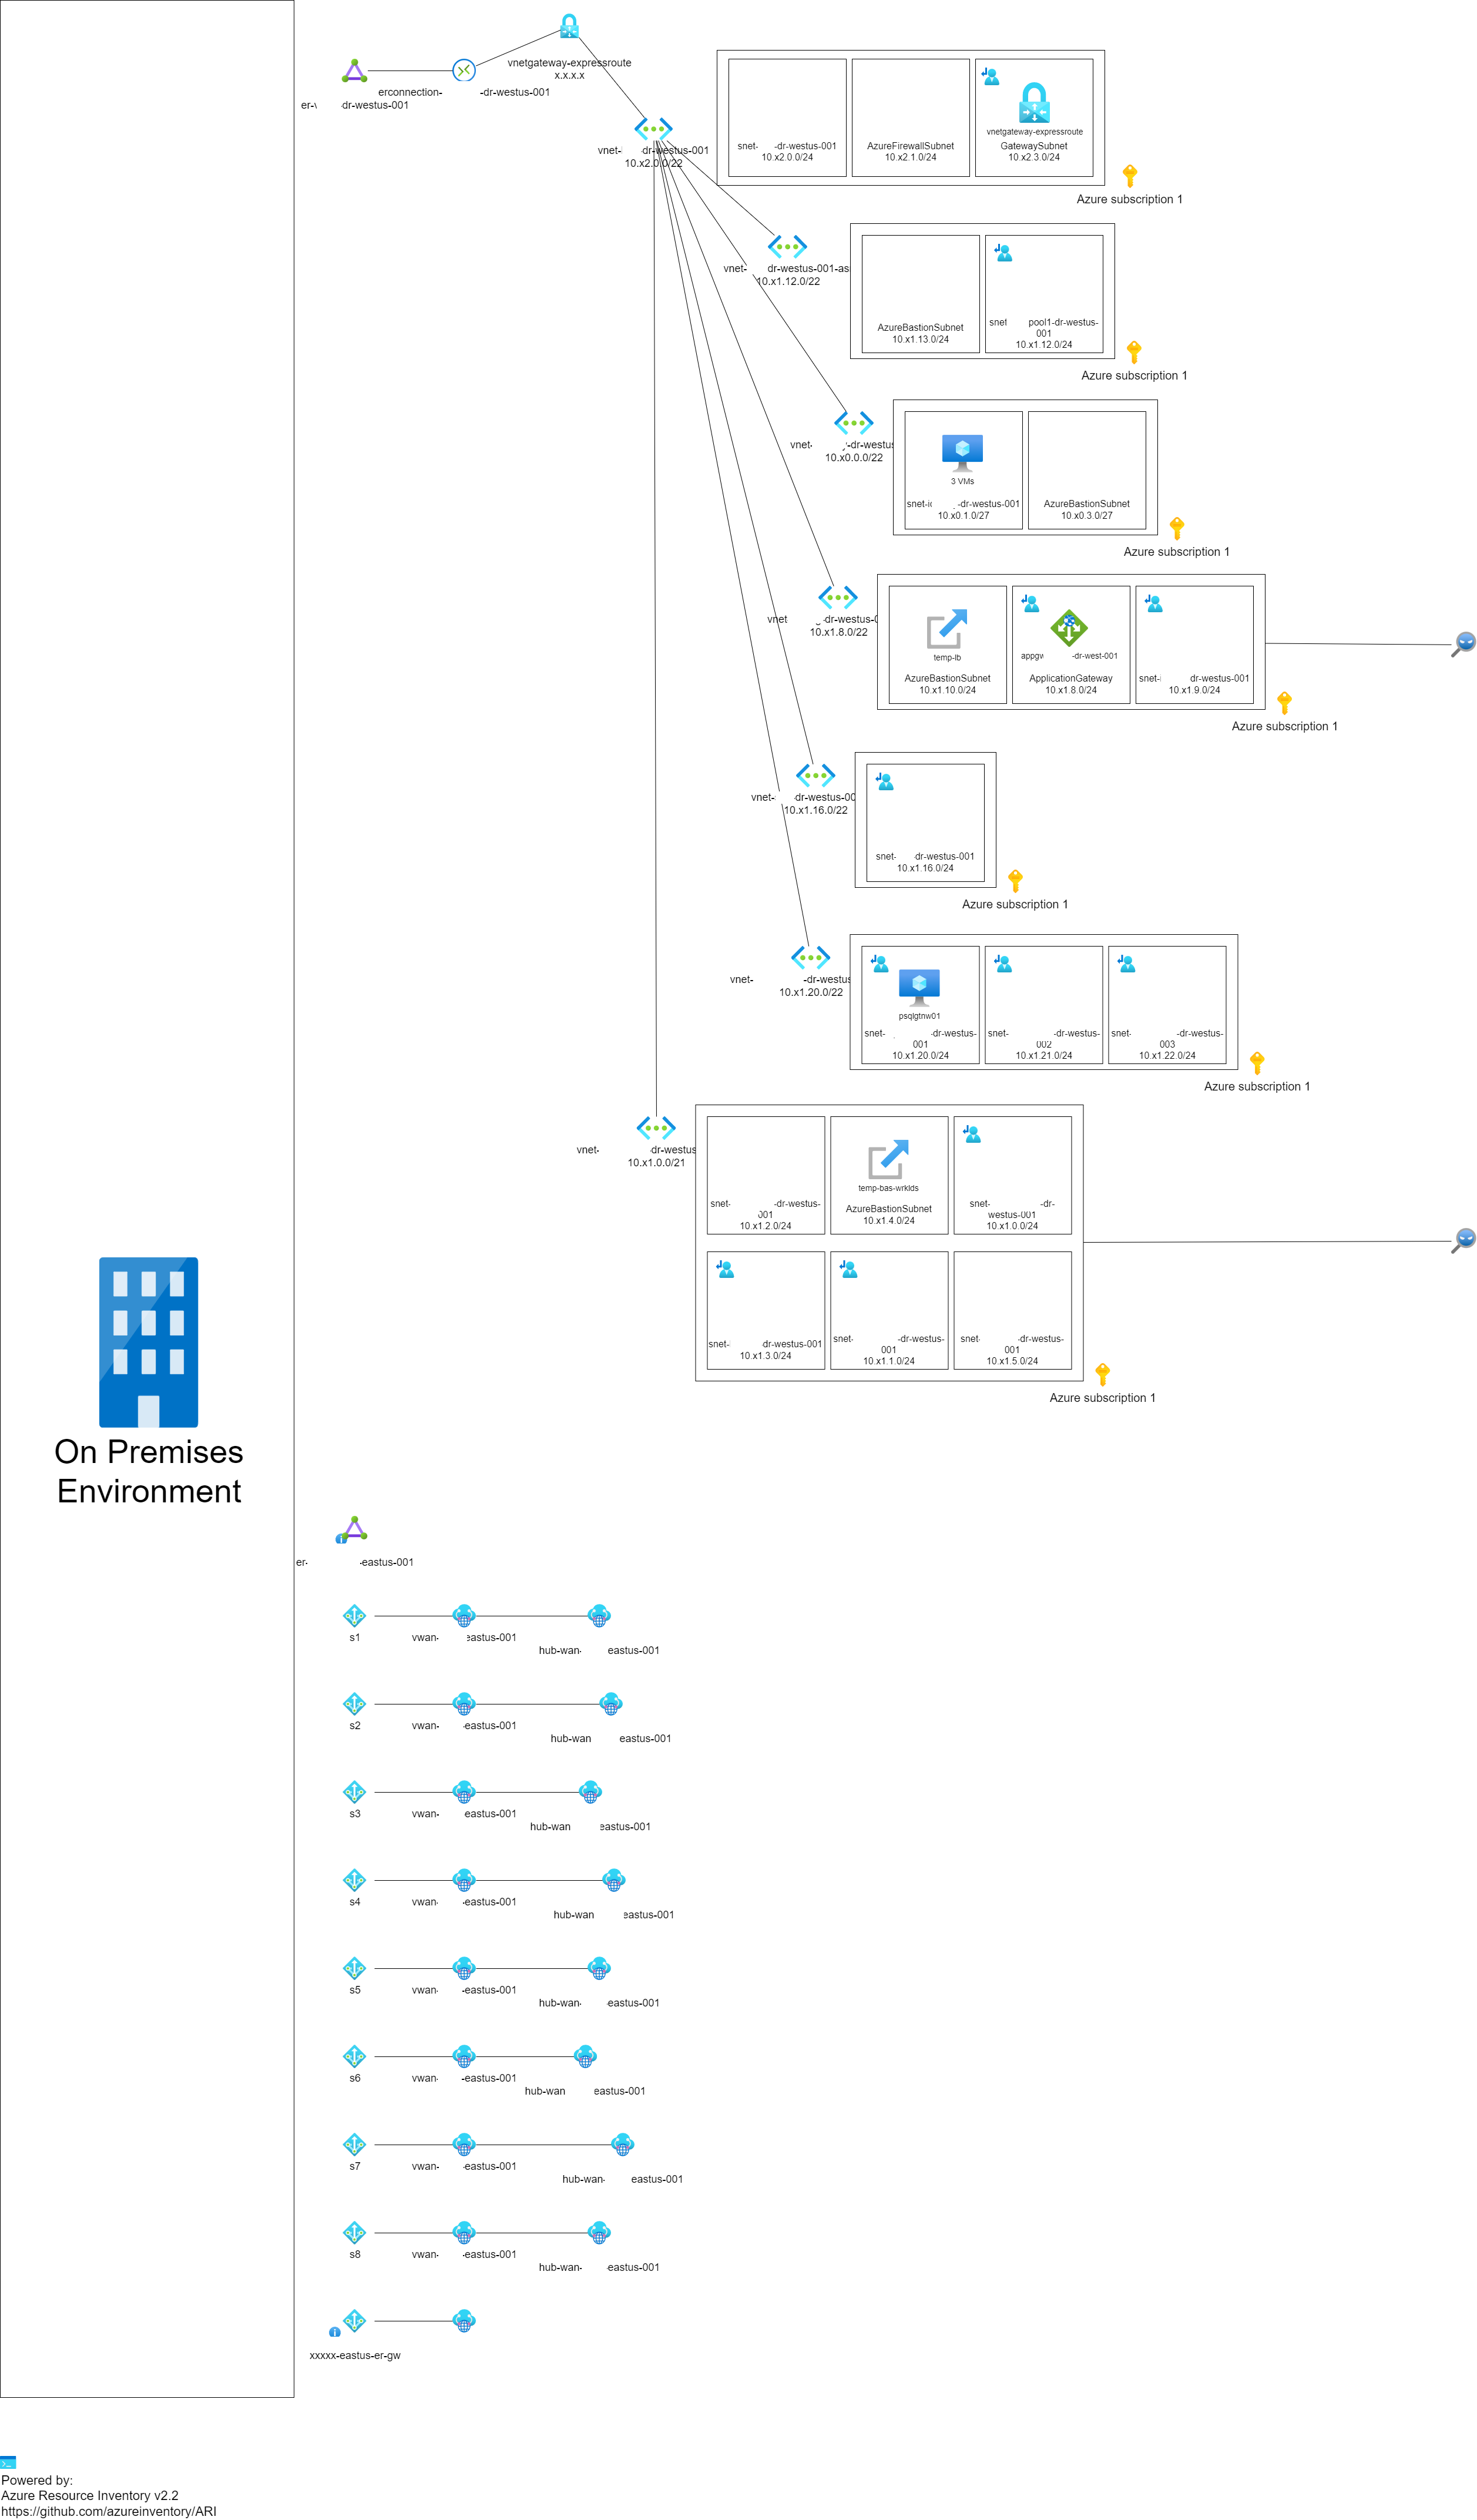
I´ve added the picture here with modified ips and names.
From what I could see, only the devices where I do not have a vWAN (WEST) are showing, plus the local S2S VPNs connected to EAST hub. No vnets on the EAST site (all connected to a firewall) are showing up.
Hello,
Sorry for the late reply, this one took some time.
Can you try the version 2.3 and see how it goes?
Thanks
Hello,
Sorry for the late reply, this one took some time.
Can you try the version 2.3 and see how it goes?
Thanks
I'll download it and ask the team to run it, I don't have access to the environment anymore :( I'll let you know.
Rgs.,
This issue has been automatically marked as stale because it has been marked as requiring author feedback but has not had any activity for 15 days. It will be closed if no further activity occurs within 15 days of this comment.