micrometer
 micrometer copied to clipboard
Calculate total memory per area
Hi, we can't create a panel on Grafana showing JVM total heap memory usage. We use InfluxDB 1.8 (with InfluxQL as query language). We can't calculate sum in query. Consider the following scenario:
- We have a step = 10s.
- We present data for i.e. 1h, so Grafana chooses 10s as grouping interval.
- When we sum all values grouping by area tag, sum of all
ids are calculated correctly. Now, let's imagine another scenario - we have a step 10s, but we present 6h, so Grafana chooses 30s as a grouping interval. Now, we sum values from 30 seconds, so our result is 3x to large.
There are some workarounds of course:
- Use fixed interval equal to step.
- Use stacked series.
- Use telegraf to gather metrics. But all above are workarounds.
What do you think? Any chances to have my solution?
@piotrekfus91 Please sign the Contributor License Agreement!
Click here to manually synchronize the status of this Pull Request.
See the FAQ for frequently asked questions.
We'll have to discuss this some internally. In general, we would rather move in the direction of having less metrics that you can otherwise calculate from other metrics, because particularly users who publish metrics to SaaS backends are concerned about the cost of metrics.
I understand your concerns, but on the other hand - for us measuring heap per space (like eden, old gen etc) is not import. What is important for us is the total amount of heap memory. And now we do not have ability to present it.
As far as I understand, metrics which are not relevant may be filtered out. So it's easy to get rid of some metrics, but difficult to add additional.
As far as I understand, metrics which are not relevant may be filtered out. So it's easy to get rid of some metrics, but difficult to add additional.
Anyone can add any metrics they want to their application. The same code added in this pull request can be added in a MeterBinder in your application code or in a shared library for multiple applications to use. I understand that may not be as convenient as it being in micrometer-core, but it is always possible to add any metrics you want.
I'm not 100% percent sure that I understand this (I might miss something). You should be able to aggregate this, the window should not matter that you are querying. In Grafana you can set the interval to constant 10s also, you can have a reference to the interval that Grafana chooses and scale your graph accordingly, Grafana also has an auto-scaling feature if you use $__interval (and its variants).
I agree with @shakuzen on having less metrics because of cost concerns, also, I don't think we should go down the path of adding every possible combination of tags and aggregate them on the client side, this should be done in the backend.
Hi @jonatan-ivanov , thank you for your reply! :)
You can set interval to constant value, but this solution has it drawbacks. Especially, in Grafana you are bound to the configuration of Micrometer (look how far we are: Micrometer sends to Influx, which is queried by Grafana, and we make dependency between Micrometer and Grafana, does not sound like a good practice/clean architecture). Now, when you change micrometer step, you have to change grafana dashboards? For me, dashboards should be independent of step configuration. Another thing - what if you have two applications - one less important, which sends metrics every 30s and one crucial, which sends metrics every 5s? (Of course it can be done using special variable on dashboard, but still...)
On the other hand - without constant interval, I don't see a good solution, how to present total heap memory. But, to be honest, in every project I have participated, I did have to observe total heap usage, and I never had to observe heap area split by id :)
Maybe we need two classes, like JvmMemoryMetrics/AggregatedJvmMemoryMetrics or DetailedJvmMemoryMetrics/JvmMemoryMetrics and give a client possibility to decide which is to use?
That's a fair point but I mentioned three things, you picked the first thing out of the three I mentioned (I mentioned them since I was not 100% percent sure that I understand this, I still think I might miss something). :)
This is a common feature for counters/gauges that you want to sum across tags. With your example, if you publish a data point every 10s and you have a 10s interval and then a 30s, it should not multiply your values by 3. Otherwise this would be an issue for everyone in the planet who wants to use sum across tags. Grafana scales automatically, that's why I'm not 100% percent sure that I understand this.
Let me try to give you a simpler example that you can test on your end and it should be easy to follow since the values are constant and they are the same for every time series.
Take a look at disk.total, this value should not really change and if you run multiple apps on the same machine (your local), this should be the same for all of them. You need to add a tag that identifies the app itself so that you will have at least one dimension.
I'm doing this in a few sample apps in this demo: https://github.com/jonatan-ivanov/teahouse.
I have 5 apps and 1TB disk space so I have 5 time series (Prometheus, I know you have Influx but the behavior should be the same):
disk_total_bytes{application="eureka", ...}
disk_total_bytes{application="spring-boot-admin", ...}
disk_total_bytes{application="tea-service", ...}
disk_total_bytes{application="tealeaf-service", ...}
disk_total_bytes{application="water-service", ...}
If I graph these by the application name, I should get 5 graphs, each at 1TB:
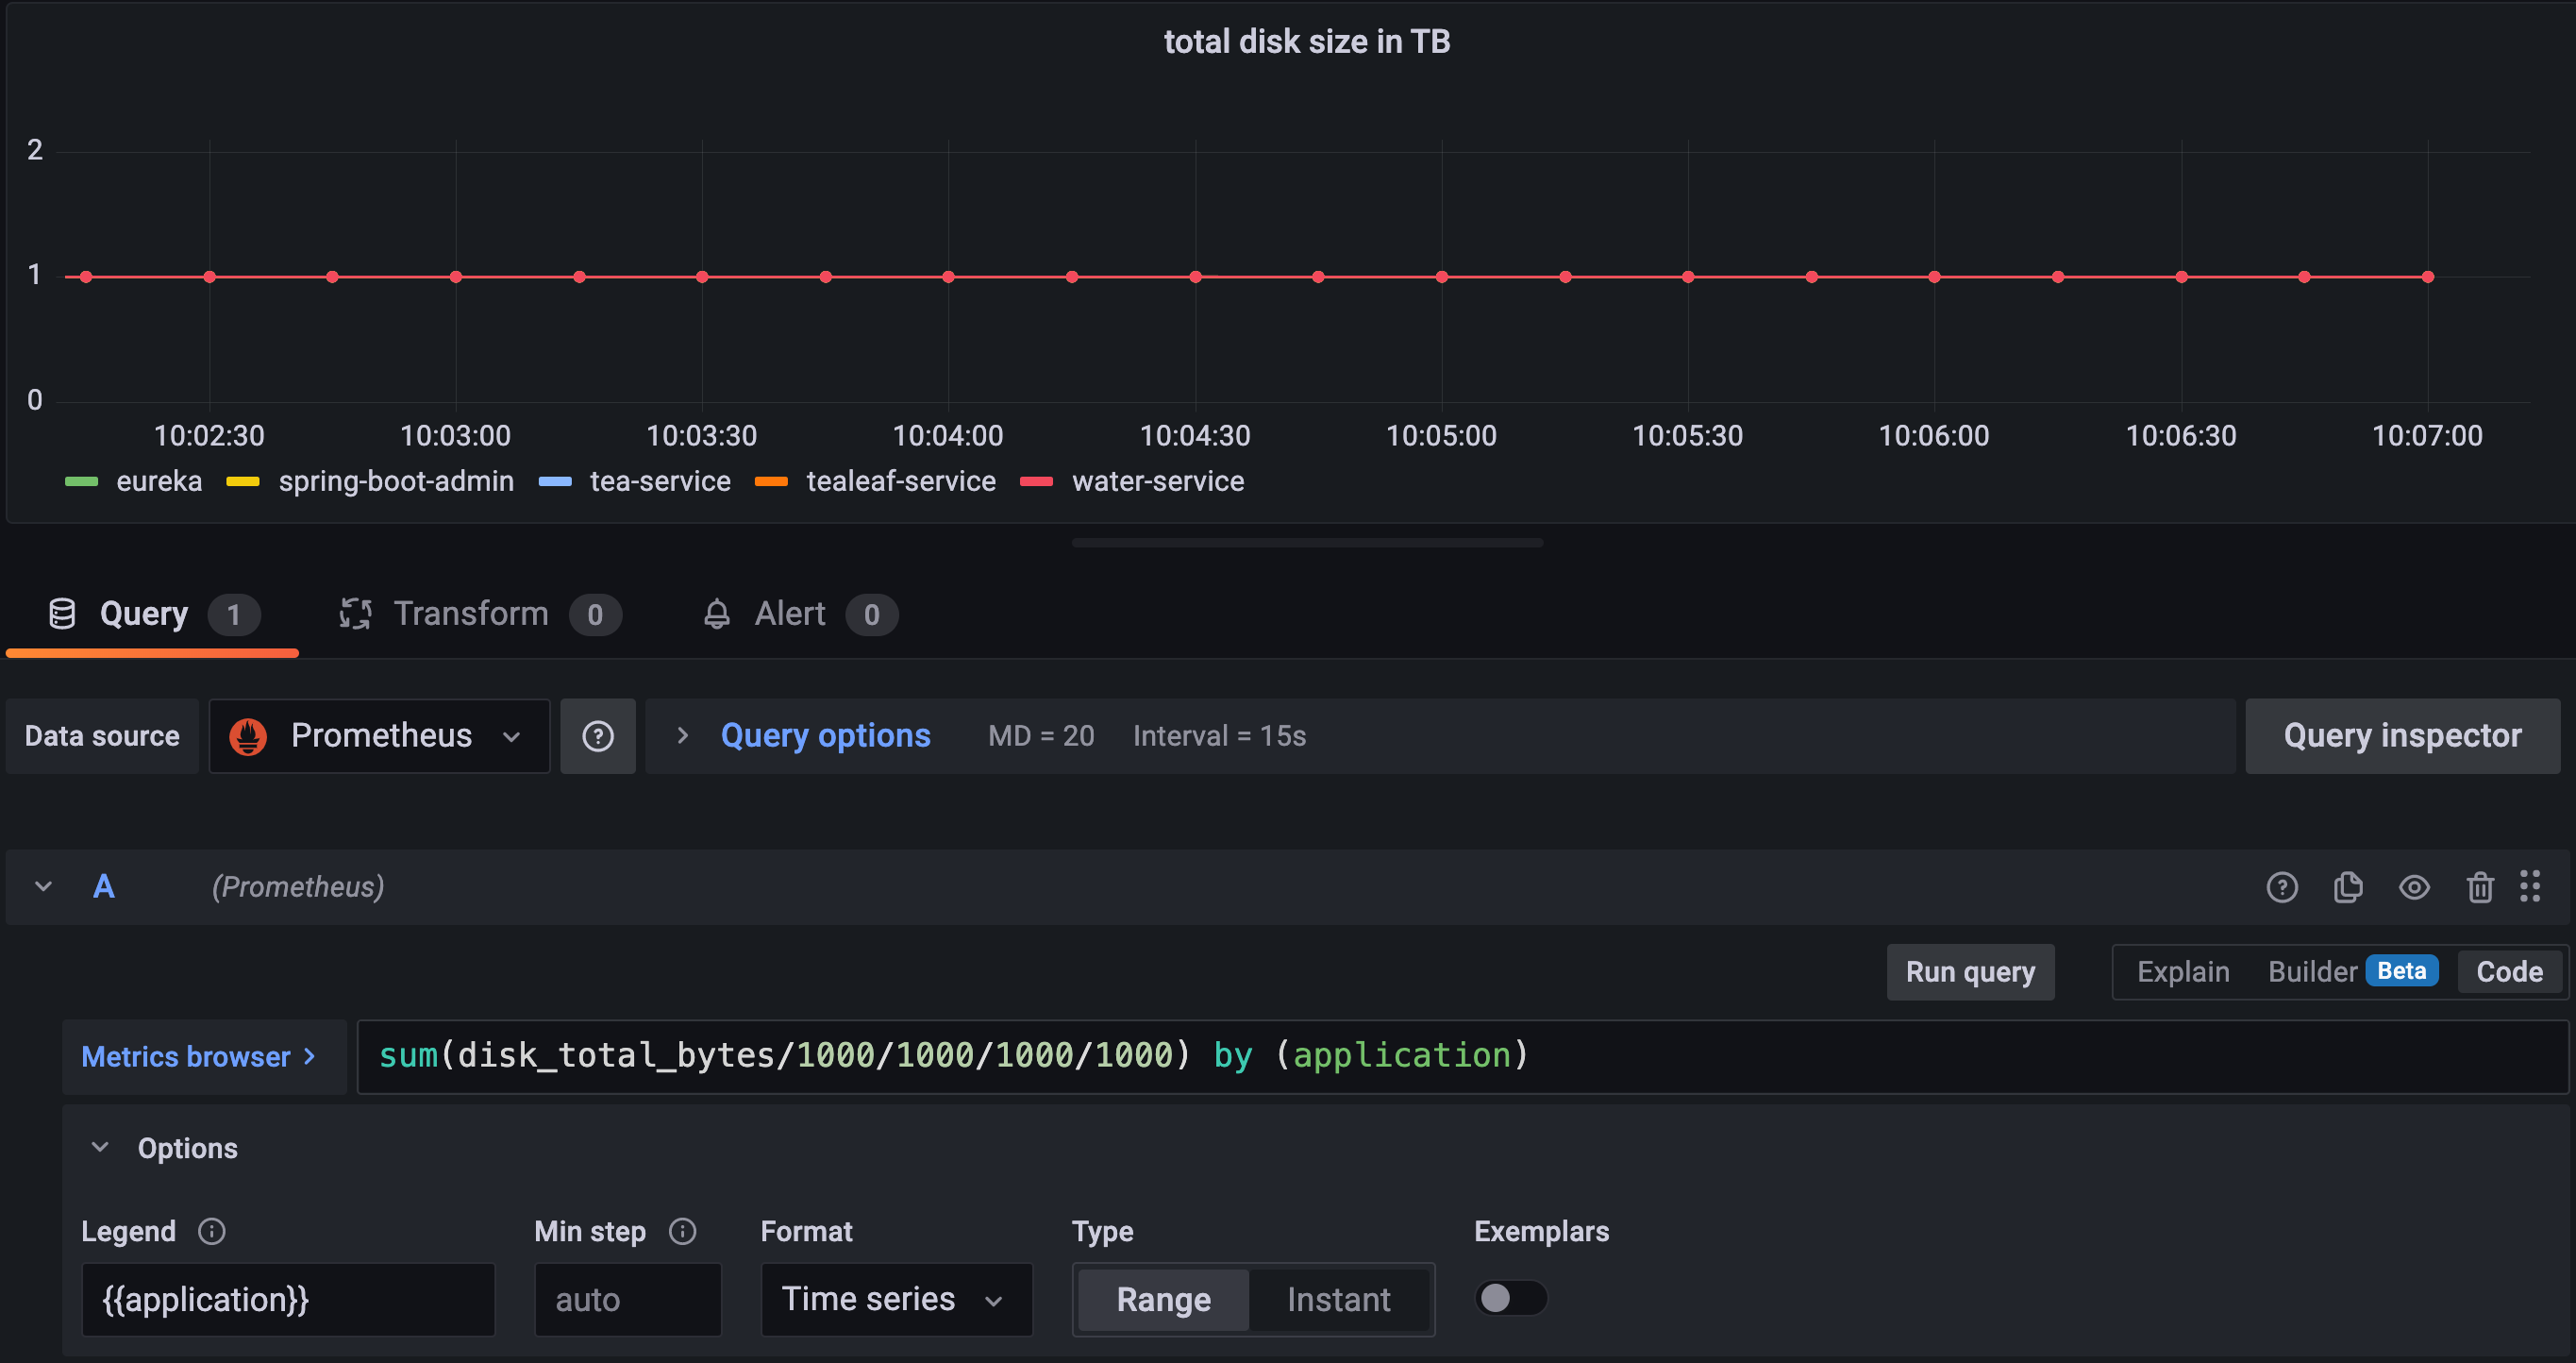
If I sum these and graph that, I should get one graph with the constant value of 5TB.
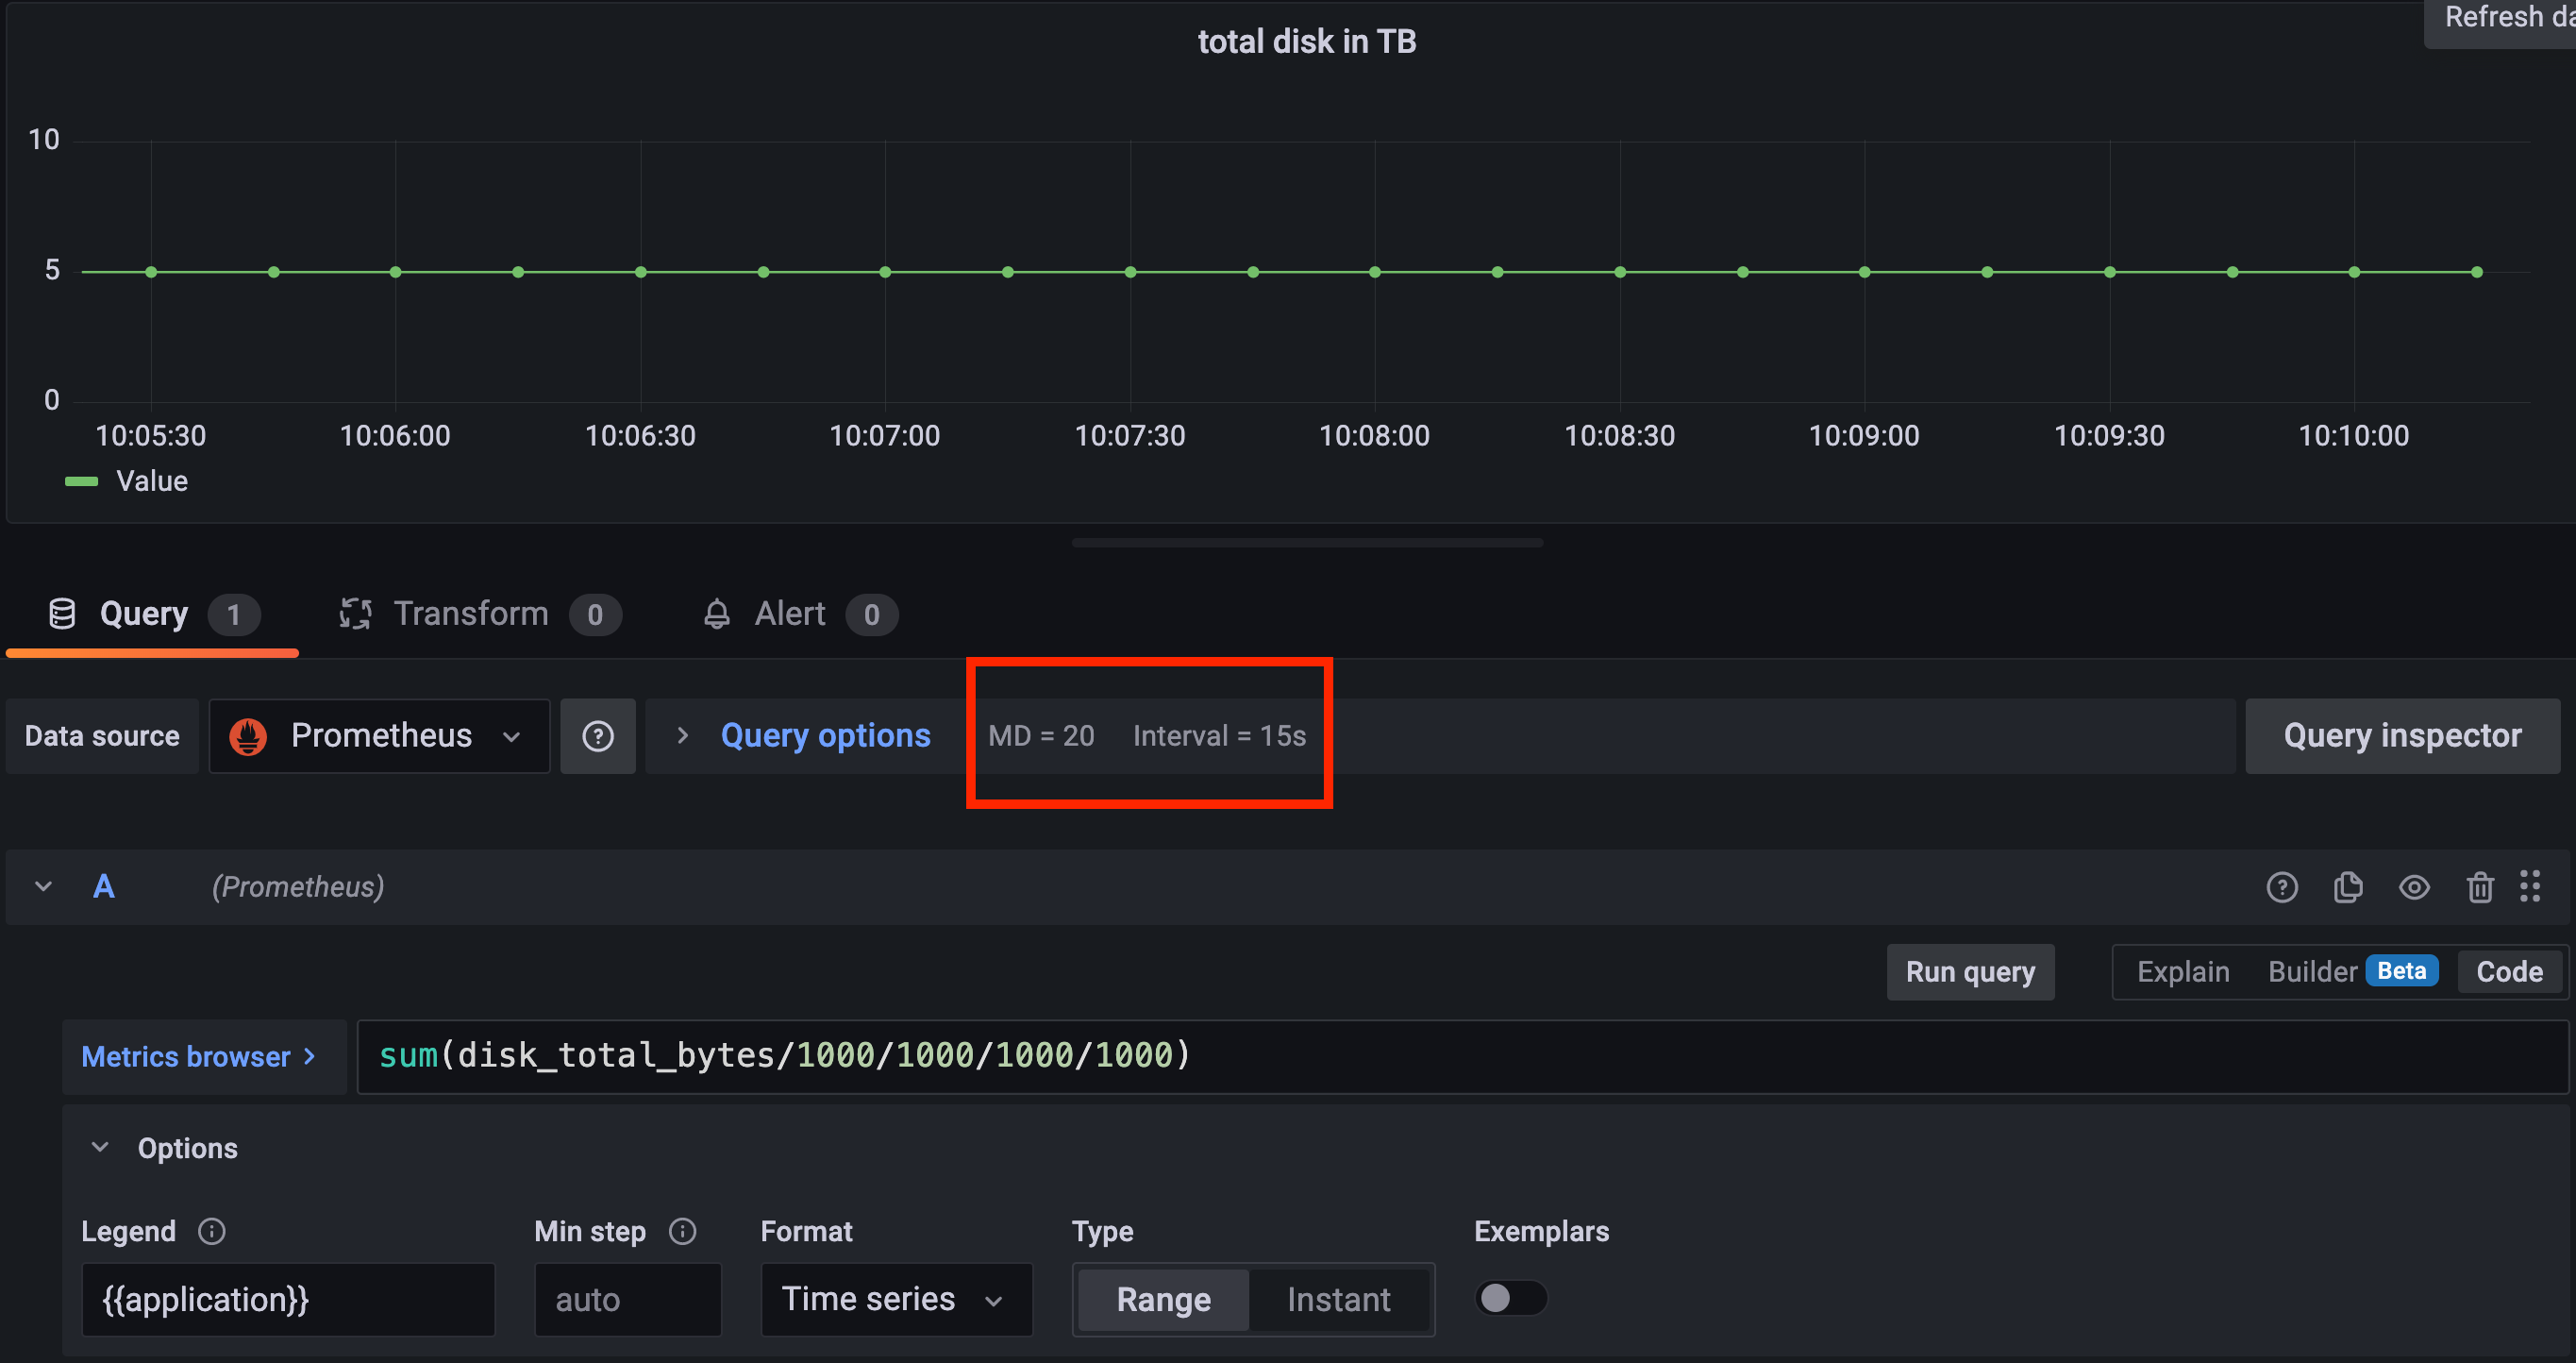
Please notice that I set the max data points to 20, I queried 5m so my interval is 15s.
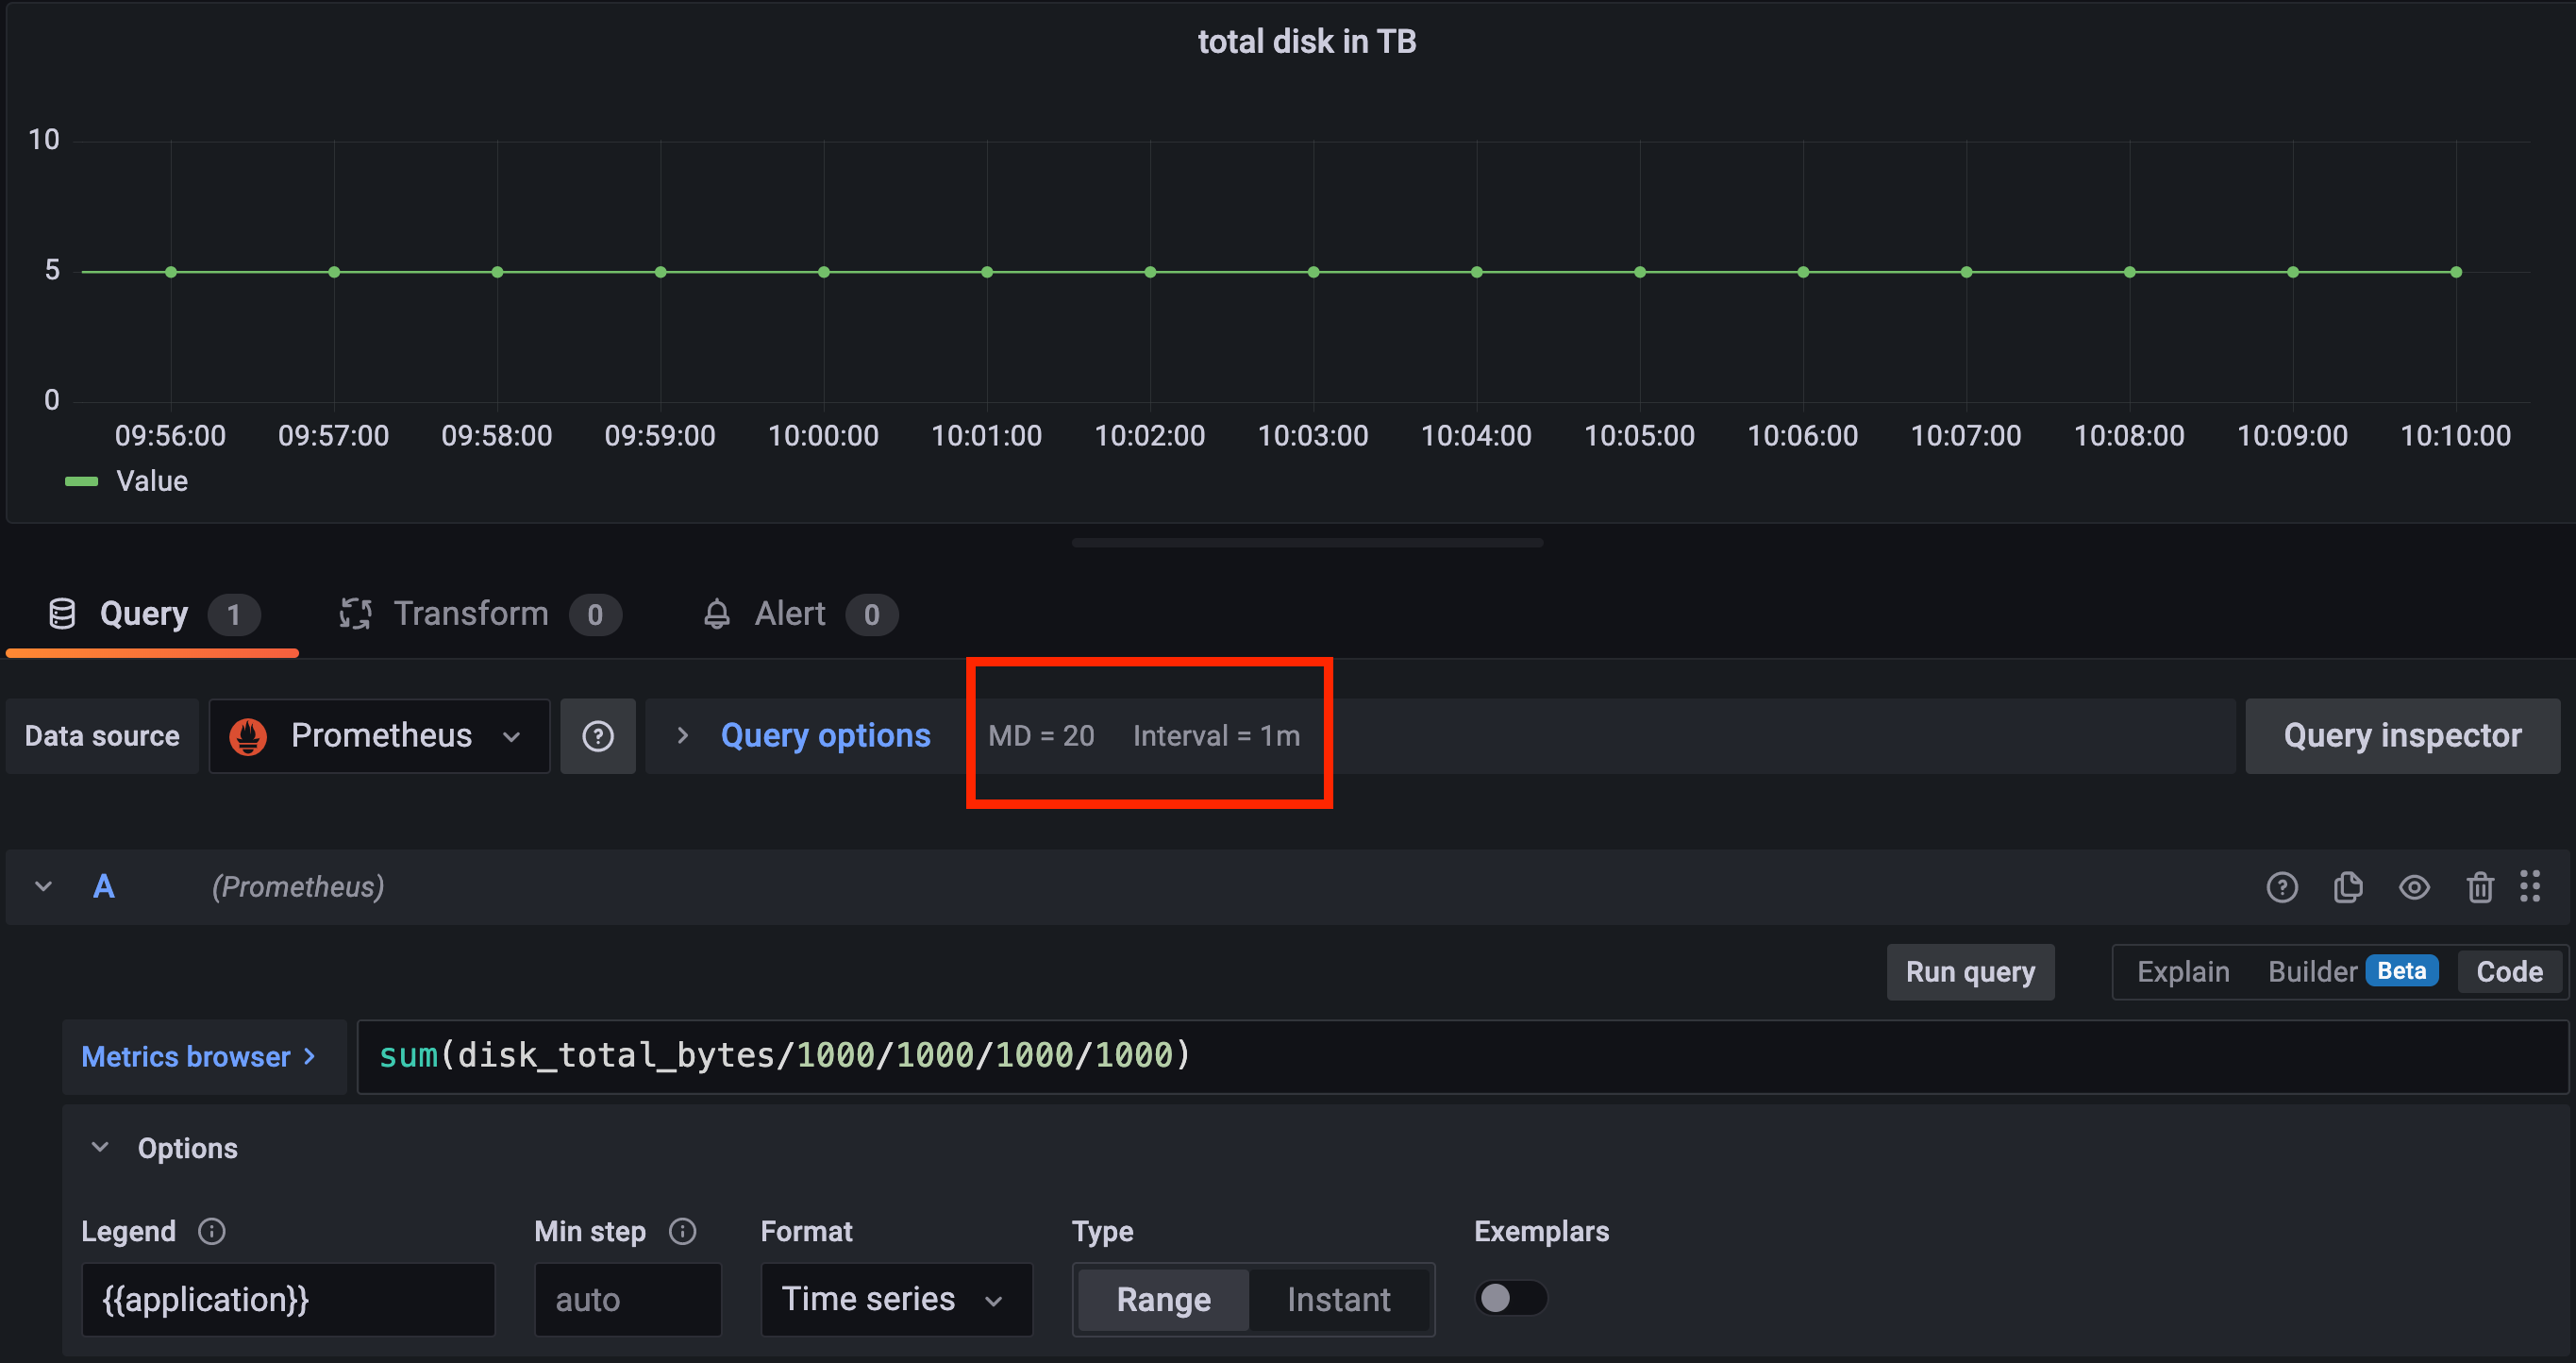
Now if I query 15m, the interval is now changed to 1m (Grafa math) but the value did not change. I'm querying 4x more data points but the sum is the same. This is the behavior you should see too.
Here is a screenshot querying 1h with 2m interval.
So my question is: what am I missing? What I showed you is the behavior I see and the behavior that makes sense to me. I also assume this is not broken for everyone and metrics libraries should not aggregate every metric across every possible tag combinations on the client side since that's the job of the backend.
I do not know Prometheus, never used it unfortunatelly. But for me - this particular example may work in InfluxDB in different way? As far as I understand, Influx takes all points of all not grouped series to aggregation - which is sum in our case. Please, take a look, maybe I'm wrong and there is a better way :)
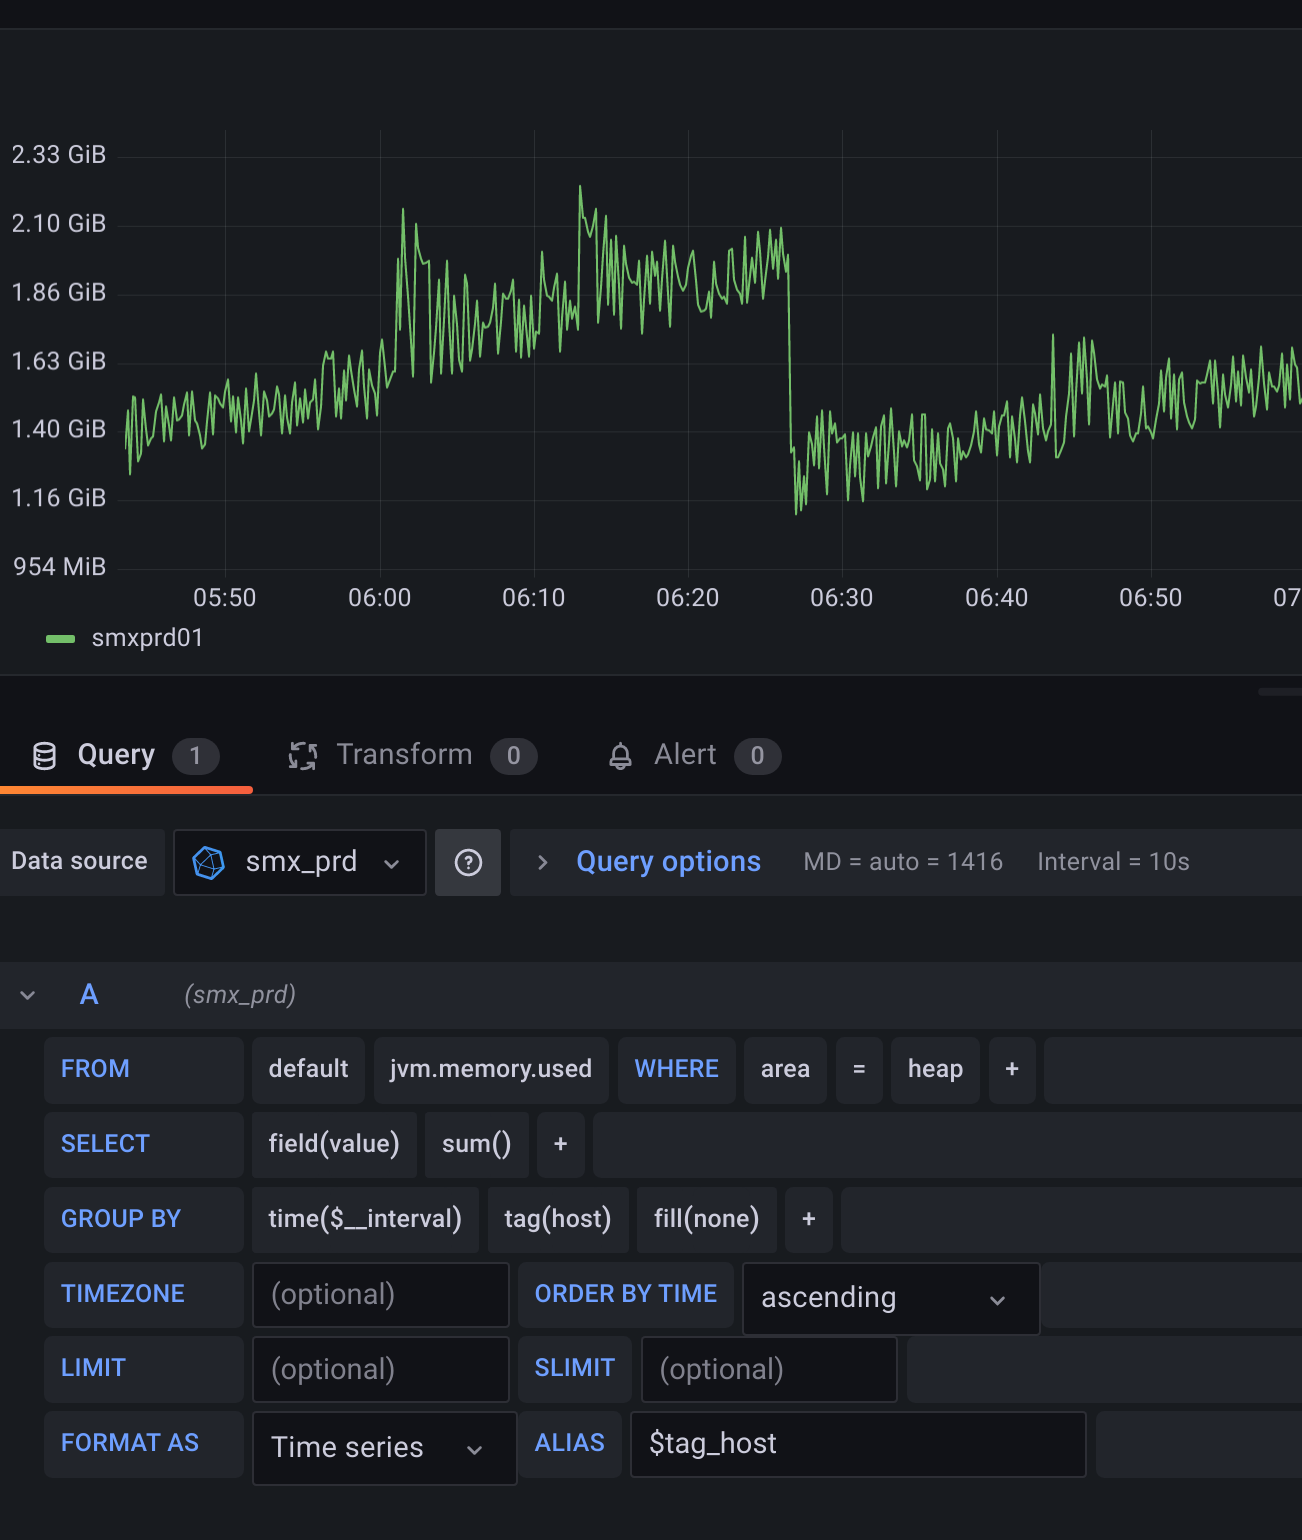
This is base image. One host, only heap, to make it more readable. When I group by id tag:
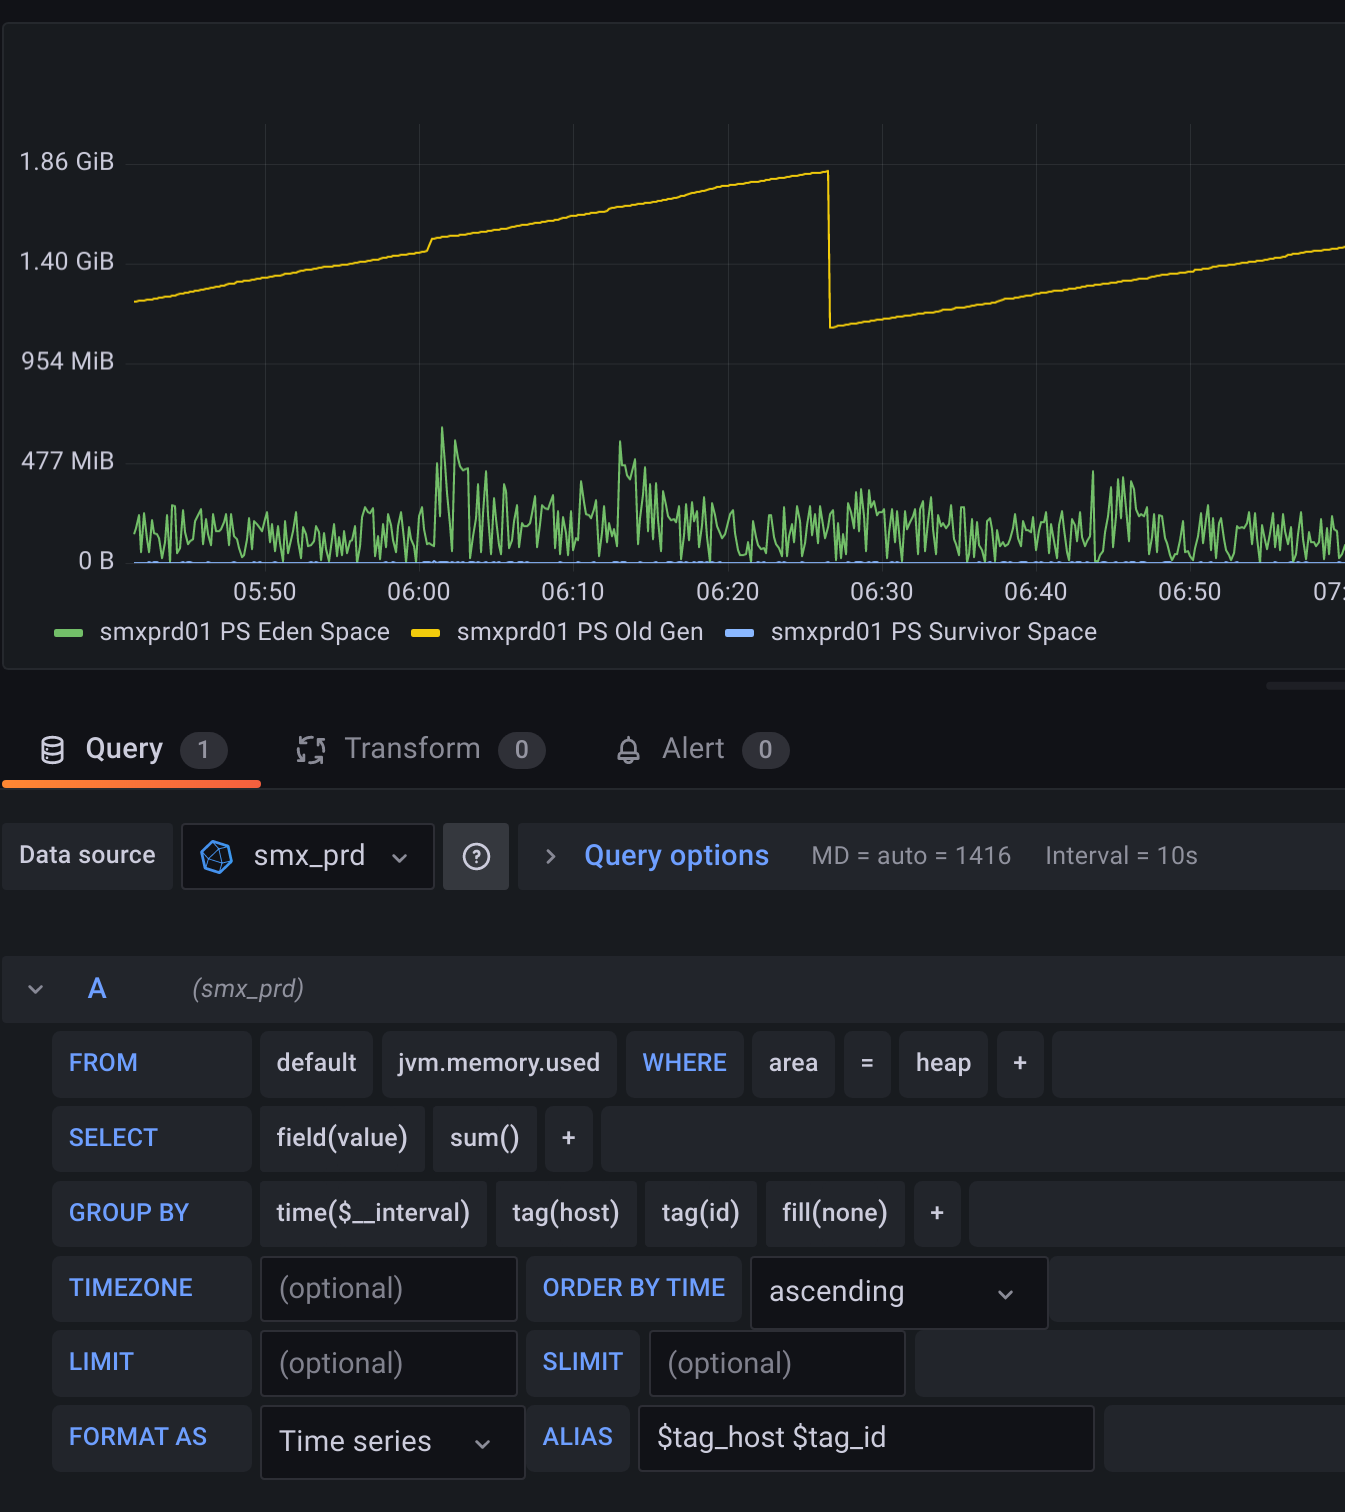
Now, what is more interesting to monitor, is to present total heap memory (without grouping by id tag):
And now, when I set larger interval:
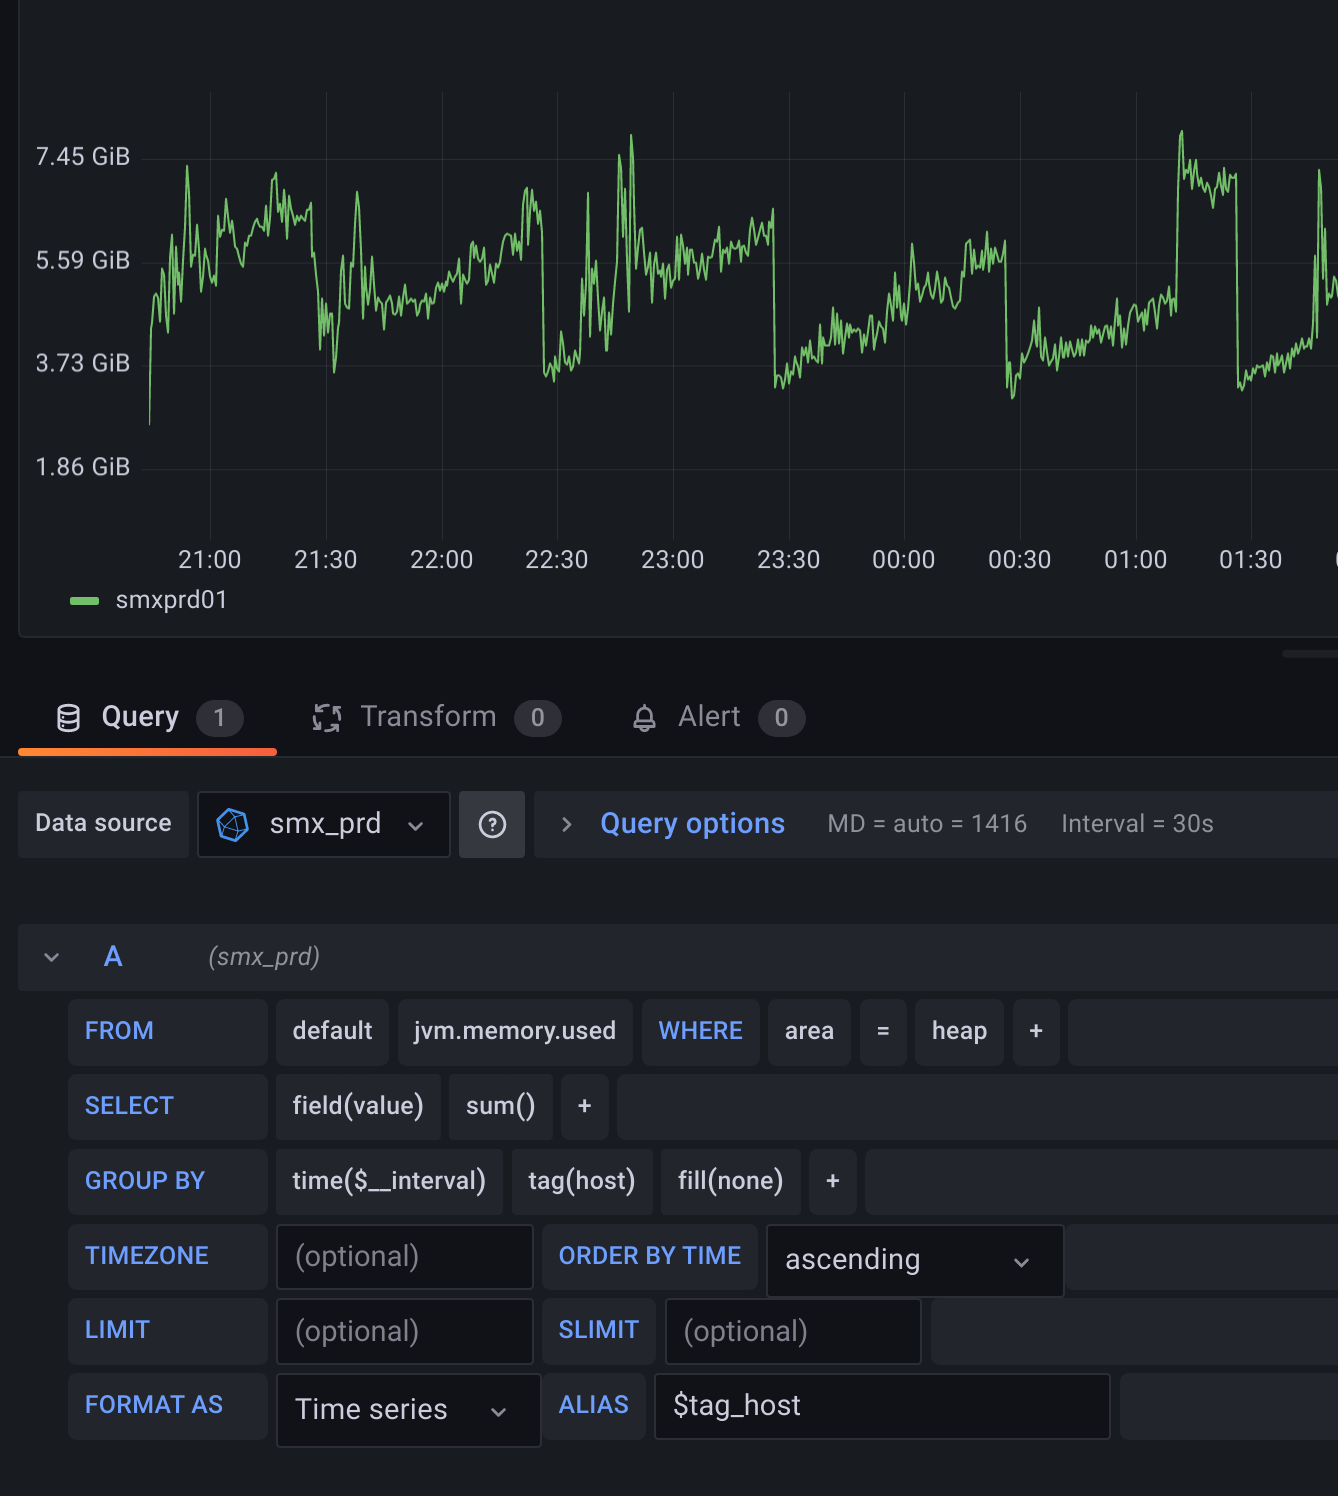
InfluxDB works this way, I'm afraid. When you do summing, all series which are not used in grouping are summed. Maybe I explained it incorrectly in previous post. What I meant is that changing interval to 30s with 10s step is not a direct mulitplication x3, it just sum values from three time points, so the results would be approximately 3x too high (because we sum points from 3 steps). Let me give you some queries:
> select id, round(value/1024/1024) from "jvm.memory.used" where area = 'heap' and host='smxprd01' limit 20;
name: jvm.memory.used
time                     id                round
----                     --                -----
2022-08-06T00:00:09.332Z PS Eden Space     913
2022-08-06T00:00:09.332Z PS Old Gen        1435
2022-08-06T00:00:09.332Z PS Survivor Space 8
2022-08-06T00:00:19.332Z PS Eden Space     558
2022-08-06T00:00:19.332Z PS Old Gen        1435
2022-08-06T00:00:19.332Z PS Survivor Space 10
2022-08-06T00:00:29.332Z PS Eden Space     219
2022-08-06T00:00:29.332Z PS Survivor Space 8
2022-08-06T00:00:29.333Z PS Old Gen        1435
2022-08-06T00:00:39.333Z PS Eden Space     80
2022-08-06T00:00:39.333Z PS Old Gen        575
2022-08-06T00:00:39.333Z PS Survivor Space 0
2022-08-06T00:00:49.332Z PS Eden Space     945
2022-08-06T00:00:49.332Z PS Old Gen        575
2022-08-06T00:00:49.332Z PS Survivor Space 0
2022-08-06T00:00:59.332Z PS Eden Space     559
2022-08-06T00:00:59.332Z PS Survivor Space 10
2022-08-06T00:00:59.333Z PS Old Gen        575
2022-08-06T00:01:09.332Z PS Eden Space     239
2022-08-06T00:01:09.332Z PS Old Gen        575
> select round(sum(value)/1024/1024) from "jvm.memory.used" where area = 'heap' and host='smxprd01' group by time(10s) limit 20;
name: jvm.memory.used
time                 round
----                 -----
2022-08-06T00:00:00Z 2356
2022-08-06T00:00:10Z 2003
2022-08-06T00:00:20Z 1663
2022-08-06T00:00:30Z 655
2022-08-06T00:00:40Z 1520
2022-08-06T00:00:50Z 1143
2022-08-06T00:01:00Z 825
2022-08-06T00:01:10Z 1626
2022-08-06T00:01:20Z 1299
2022-08-06T00:01:30Z 969
2022-08-06T00:01:40Z 609
2022-08-06T00:01:50Z 1437
2022-08-06T00:02:00Z 1070
2022-08-06T00:02:10Z 700
2022-08-06T00:02:20Z 1543
2022-08-06T00:02:30Z 1247
2022-08-06T00:02:40Z 956
2022-08-06T00:02:50Z 639
2022-08-06T00:03:00Z 1475
2022-08-06T00:03:10Z 1163
> select round(sum(value)/1024/1024) from "jvm.memory.used" where area = 'heap' and host='smxprd01' group by time(120s) limit 20;
name: jvm.memory.used
time                 round
----                 -----
2022-08-06T00:00:00Z 16105
2022-08-06T00:02:00Z 13836
2022-08-06T00:04:00Z 14054
2022-08-06T00:06:00Z 13976
2022-08-06T00:08:00Z 15388
2022-08-06T00:10:00Z 14249
2022-08-06T00:12:00Z 15871
2022-08-06T00:14:00Z 16006
2022-08-06T00:16:00Z 15169
2022-08-06T00:18:00Z 14859
2022-08-06T00:20:00Z 15182
2022-08-06T00:22:00Z 13228
2022-08-06T00:24:00Z 15765
2022-08-06T00:26:00Z 14118
2022-08-06T00:28:00Z 16236
2022-08-06T00:30:00Z 16050
2022-08-06T00:32:00Z 16006
2022-08-06T00:34:00Z 16287
2022-08-06T00:36:00Z 14631
2022-08-06T00:38:00Z 15669
I did some quick googling. I may be wrong, but for me Influx's sum function works more like sum_over_time in prometheus - maybe this is why we can't understand each other? :)
@piotrekfus91 I still need to look into this using Influx but I still think that what I wrote above must hold:
I also assume this is not broken for everyone and metrics libraries should not aggregate every metric across every possible tag combinations on the client side since that's the job of the backend.
Or to put it into a different perspective: I don't think this is going to be merged, otherwise we should do this for every arbitrary combination of time series.
Hi, i finally managed to do it correctly. I found the feature of subqueries that I was not aware of. This subqueries allow to aggregate series. So indeed - this PR is no longer appropriate. Thanks for interesting discussion and sorry for taking your time :) For other people looking for the solution:
SELECT sum("value") as value
FROM (
    SELECT max("value") AS value
    FROM "jvm_memory_used"
    WHERE ("app" =~ /^$app$/ AND "host" =~ /^$host$/ AND "area" = 'heap') AND $timeFilter
    GROUP BY time($__interval), "app", "host", "id" fill(none)
)
GROUP BY time($__interval), "app", "host"