Location data off for Sacramento County
Hi,
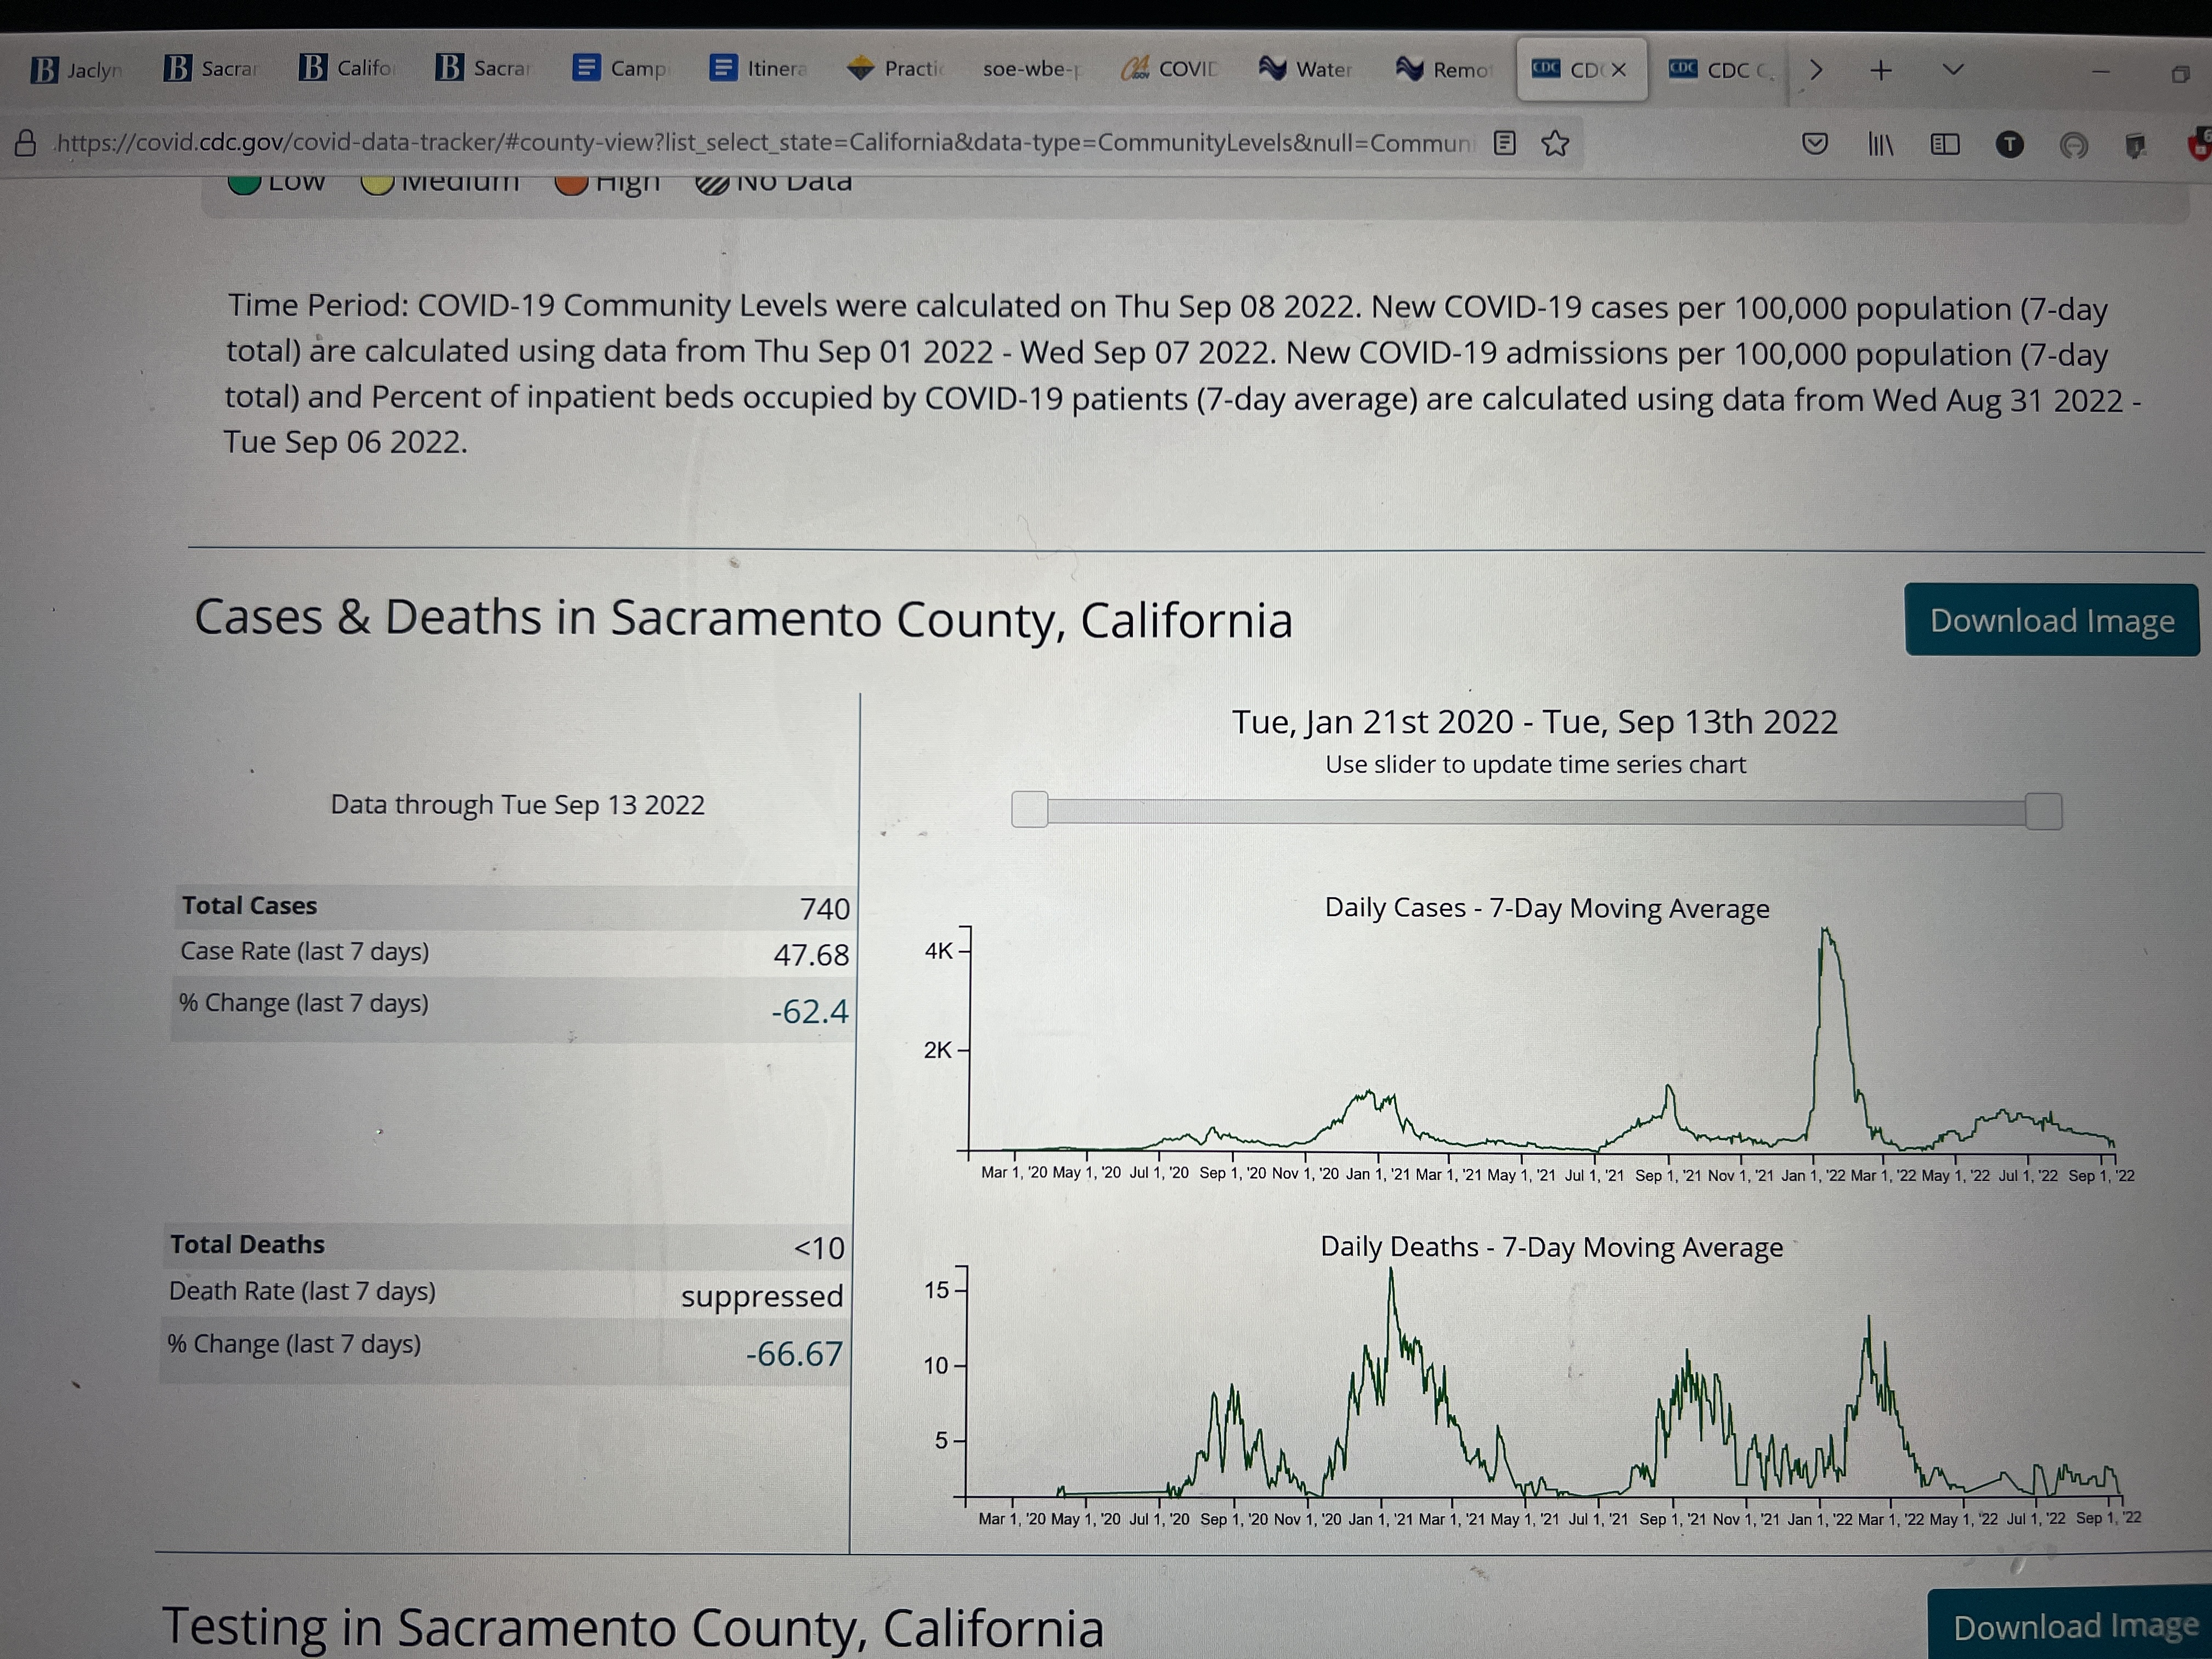
My family and I are regular users of the microcovid.org calculator and are confused about what we’re seeing under location data.
Numbers have been steadily declining in our county, Sacramento County, California. As of 9/13, according to the CDC, prevalence was only 740 cases reported in the last 7 days, a drop of 62.4% from 7 days prior. Yet, on 9/14, the calculator said that as of 9/13 Sacramento County had 2,394 cases reported, an increase of 200,000% from the week prior. 😟 Similar off numbers today.
I’ve attached a couple of screenshots that show the above. Any idea what the problem is and when it might be fixed?
Thanks. 🙂
Warmly, Tiffany

Thanks for the report, @tibbons2!
Some bread crumbs if someone volunteers to investigate this:
- Our data ingestion script is here: https://github.com/microCOVID/microCOVID/blob/main/update_prevalence.py
- You can run it via steps here: https://github.com/microCOVID/microCOVID/#prevalence-updates
- For the US, we pull country-, state- and county-level data all from an aggregated dataset maintained by Johns Hopkins University - you can look at the
parse_jhu_vaccines_global()andparse_jhu_vaccines_us()functions to see those.
I'd probably start by checking the CDC numbers against those provided by Johns Hopkins. If they are different, you can pursue with them at https://github.com/govex/COVID-19; if they are similar or the same, you could see if the issue still can be reproduced (the effective_date variable is probably what you want to rewind time). Perhaps the upstream issues have been resolved already. We might even be able to confirm that by looking at commit history in their GitHub repo. Not sure if the CDC provides that level of transparency in their data, but worth a look in case the correction was on CDC's side.
Thanks so much for responding to this Vince. 😊 The issue is actually an ongoing one. I check the data every time I use the calculator now, and about a third of the time replace the number of cases with what the CDC is saying because the number in the calculator is implausible. I know everyone here is volunteering, but I do hope someone is willing/able to look into this, because it is having a profound effect on a very basic element of the calculator. I wish I had the skills to look into it/volunteer myself, but alas. Thanks so much to all those who are contributing in this way. 🙏🏼
@tibbons2: No worries! Yeah, if you find a way to get the word out, we're looking for volunteers. I wrote up some of the common issues that I'm aware of in that post - my guess is that this is tied to microCOVID not being robust against irregular reporting by the jurisdiction. But if not, perhaps someone can track it down to being something being broken between the jurisdiction and JHU, or JHU and microCOVID. For instance, here's the JHU CSV that we pull data from for the US - does it look to be the same as the CDC data? https://raw.githubusercontent.com/govex/COVID-19/master/data_tables/vaccine_data/us_data/time_series/time_series_covid19_vaccine_us.csv
That CSV should help answer what the next step is.
I’ll see what I can do to get the word out about the need for volunteers. Thanks again so much for your work on this. 🙏🏼