metrics
 metrics copied to clipboard
[metrics-exporter-prometheus] Summary histograms do not use sliding time windows
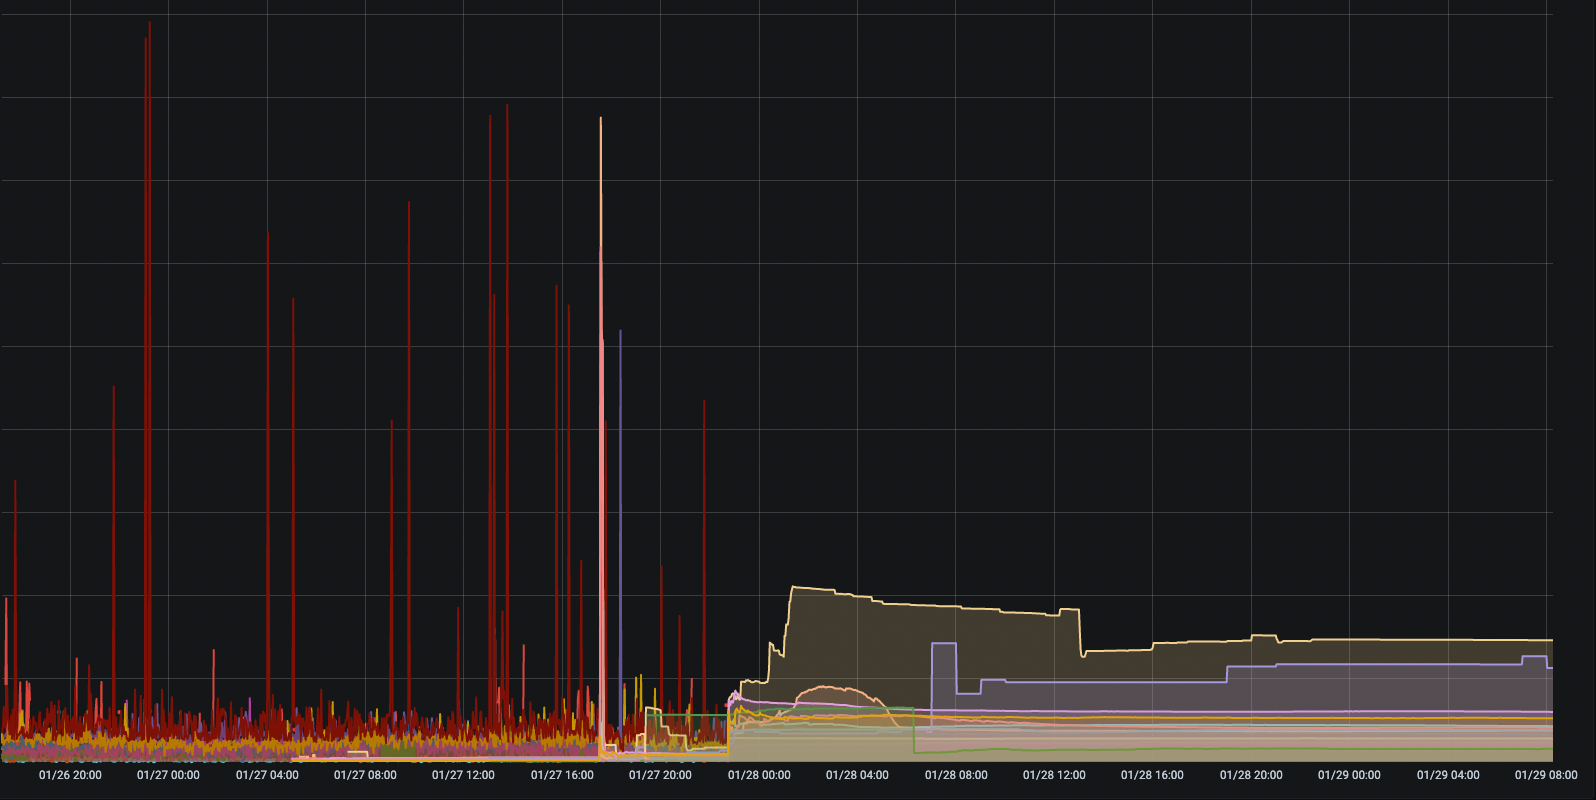
According to the prometheus docs summaries should be calculated based on sliding time windows. Looking at the code, this appears to not be implemented for metrics_util::Summary, which is instead a summary over the entire range of data throughout the application's total runtime. This means that long-running applications will have their histogram values stabilize and spikes in the dataset will become virtually invisible. This is a graph of a metric with a previous internal monitoring tool which did use sliding time windows for summaries, which was switched over to metrics-exporter-prometheus around 22:00UTC on 2022-01-27. You can see the granularity of the data disappear after the switch and the data begin to drift towards a stable value.
Either metrics-exporter-prometheus or metrics_util::Summary should provide by default or provide optionally, sliding time windows.
Thanks for reporting this.
While I understand the current behavior of aggregated summaries is suboptimal for long-running processes, I'm not sure I have the time to craft an enhancement to make them use a sliding time window under the hood.
I'd be willing to review a PR that does as much, as well as gently mentor/guide such a PR.
Very belated update, but: this should be solved as of #306, which was released as [email protected].