Performance problem with the pivot table
Context: I have a 7871 row table in postgresql v13 that needs to be represented as a pivot table with
- 5 groups of rows
- 5 measures
Metabase takes more than 13 seconds to display the pivot table.

The slowness does not come from the database.
I used the pg_stat_statements extension to find out what is going on in the database
1 - reset of statistics
select pg_stat_statements_reset()
2 - display of the pivot table in metabase
3 - recovery of statistics
with stat as ( SELECT query, calls, total_exec_time, rows FROM pg_stat_statements where query like '-- Metabase%' ) select count(*) as countQuery,sum(total_exec_time) as total_time,sum(rows) as count_total_rows from stat
We obtain
- 32 sql queries
- 512 ms total time
- 7314 rows
The database process therefore takes 517 ms out of the 13 seconds
I think the problem comes from the transformation of the results for the client. (there are 7314 rows to transform). From my experience, databinding by ORMs are not performing well database -> ORM -> Serialization -> JSON
3 levels of optimization:
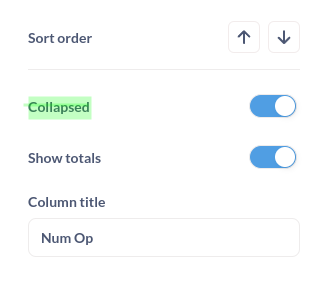
1 - limit the data to the client with an asynchronous mode on the pivot component to get the data on demand. By default, set a collopsed=true to get at least the aggregated data.
add collapsed option in window config

2 - improve the efficiency of the data transformation (database to metabase client)
3 - improve the performance of the database
- make a single query instead of the 32 in the example by using the "union" operator, thus allowing to take advantage of the parallelization of the database.
- use the multiple grouping operation (group by rollup() ) allowing to browse the data volume only once
Looking at the reported issue, it's the API request that takes 13s, so I think this is (for once!) not entirely a front-end issue.
I was able to reproduce something similar. I think this is largely due to the fact that pivot data is enormous. I did a group with 4 dimensions and it gave me a 17.9MB json and took 39s just to get an API response.
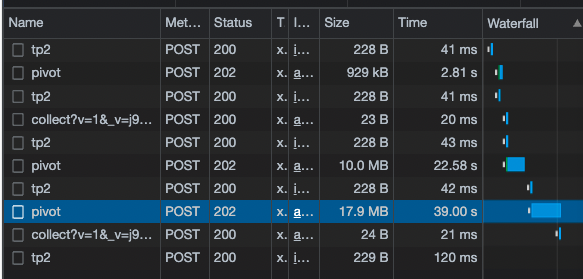

It takes about 10s for the front-end to render after that. (I'm sure the FE could be optimized better to handle a 17MB json)
Behavior is basically the same on 45.0. I don't think this is a x.46.x regression. Column resizing in x.46.x will also cause a redraw, which exposes an existing performance bottleneck, rather than creating a new one.
https://www.loom.com/share/16d47d3c627443459c528f47a523dcc8
update: Behavior is essentially the same in metabase x.43.x as well
I did some analysis with some local data and can reproduce similar behavior as seen in this Loom. Please let me know if you'd like my dataset for reproduction.
Hey, Same issue here. From my analysis of generated SQL
- Metabase is computing all totals and subtotals even if we choose to not display them in the pivot table -> lot of computing for nothing.
- Metabase is computing them sequentially. Why not sending all the SQL queries in parallel to the database?
BR