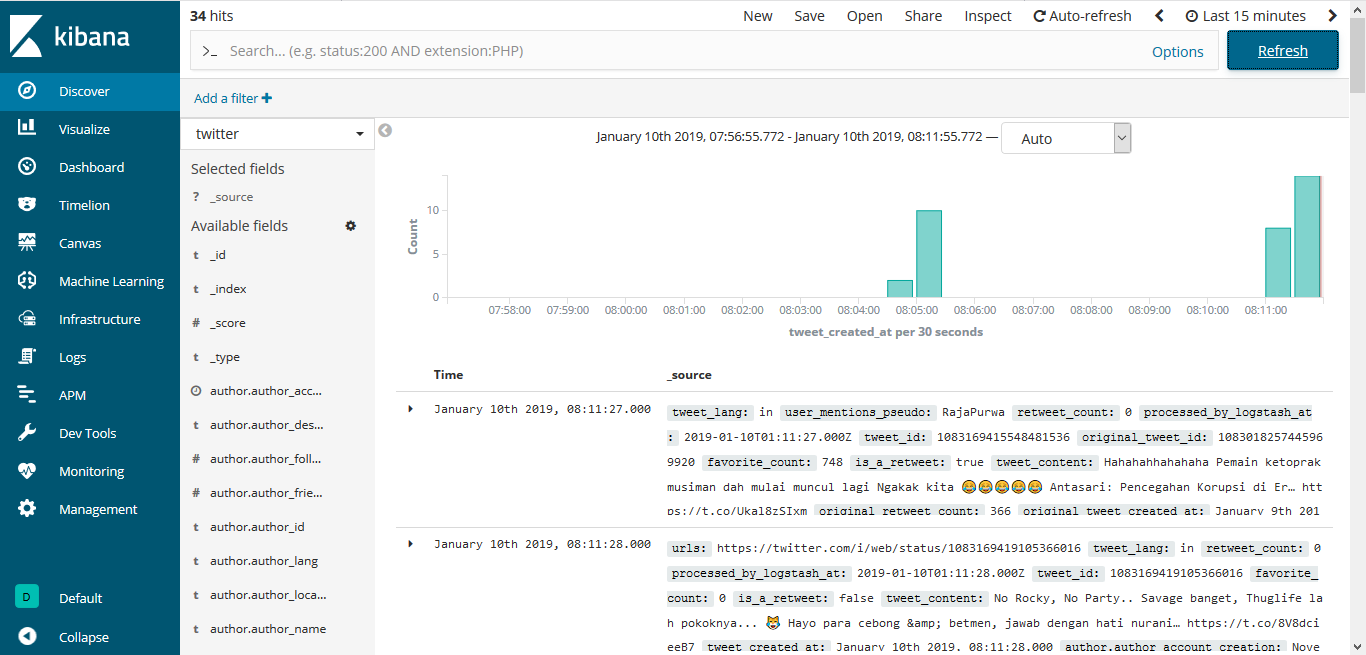
No results found in KIbana
Hi melvynator
Thanks for a awsome project and for sharing !
I am getting No results found in KIbana, tried the mapping you suggested in https://github.com/melvynator/ELK_twitter/issues/9
I tried on both ELK stack 6.1.4 and the latest 6.5.4
On 6.5.4 I can see the document count increasing also on timelion I dont see any data looks like kibana cant see the data in elasticsearch
Please help
Thanks Jaco
I can see data in elasticsearch if I run <GET twitter/_search> this is on ELK 6.5.4
<{ "took" : 1, "timed_out" : false, "_shards" : { "total" : 1, "successful" : 1, "skipped" : 0, "failed" : 0 }, "hits" : { "total" : 344, "max_score" : 1.0, "hits" : [ { "_index" : "twitter", "_type" : "doc", "_id" : "1080439295679303680", "_score" : 1.0, "_source" : { "processed_by_logstash_at" : "2019-01-02T12:22:56.000Z", "original_tweet_id" : "1080311225823752192", "original_tweet_created_at" : "2019-01-02T03:54:02.000Z", "original_author" : { "author_location" : "California, USA", "author_friends_count" : 1135, "is_author_verified" : true, "author_account_creation" : "2008-10-03T04:16:17.000Z", "author_pseudo" : "netflix", "author_lang" : "en", "author_id" : "16573941", "author_followers_count" : 5503501, "author_name" : "Netflix US", "is_author_protected" : false, "author_description" : "i chose sugar puffs and i will NOT apologize" }, "tweet_content" : "ATTENTION SWIFTIES: It’s here!! https://t.co/MScfmVjD3m", "original_retweet_count" : 1766, "tweet_id" : "1080439295679303680", "author" : { "author_followers_count" : 1316, "author_name" : "anna ☄️ 1016", "author_location" : "1016", "author_friends_count" : 507, "author_account_creation" : "2014-08-11T14:36:53.000Z", "author_lang" : "en", "author_pseudo" : "flickerofswift", "author_description" : "reputation Stadium Tour London Night 2⚡️", "author_id" : "2739923751" }, "user_mentions_pseudo" : [ "netflix" ], "retweet_count" : 0, "tweet_created_at" : "2019-01-02T12:22:56.000Z", "tweet_lang" : "en", "is_a_retweet" : "true", "favorite_count" : 8452, "user_mentions_id" : [ "16573941" ] } }, { "_index" : "twitter", "_type" : "doc", "_id" : "1080439296644055042", "score" : 1.0, "source" : { "processed_by_logstash_at" : "2019-01-02T12:22:56.000Z", "original_tweet_id" : "1078787082573791232", "original_tweet_created_at" : "2018-12-28T22:57:38.000Z", "original_author" : { "author_location" : "Toulon, France", "author_friends_count" : 201, "is_author_verified" : false, "author_account_creation" : "2016-10-28T22:53:50.000Z", "author_pseudo" : "carramel", "author_lang" : "fr", "author_id" : "792137327577563136", "author_followers_count" : 79, "author_name" : "©", "is_author_protected" : false, "author_description" : """🇸🇳 🇷🇼""" }, "tweet_content" : "La série You sur netflix elle a clairement été pensé par un vrai psychopathe", "original_retweet_count" : 3081, "tweet_id" : "1080439296644055042", "author" : { "author_followers_count" : 11963, "author_name" : """ℳ𝑎𝑦𝑜𝑢""", "author_location" : "Portugal", "author_friends_count" : 727, "author_account_creation" : "2014-05-23T16:48:27.000Z", "author_lang" : "fr", "author_pseudo" : "incrxvel", "author_description" : """já ninguem sabe o que é felicidade e quem sabe já so vive na saudade | 🇵🇹""", "author_id" : "2518236690" }, "user_mentions_pseudo" : [ "carramel" ], "retweet_count" : 0, "tweet_created_at" : "2019-01-02T12:22:56.000Z", "tweet_lang" : "fr", "is_a_retweet" : "true", "user_mentions_id" : [ "792137327577563136" ], "favorite_count" : 4543 } },
Hi @jakes670, I just solved it by myself by removing inserted_in_es_at from twitter_template.json and when creating index pattern in Kibana, I choose tweet_created_at as time filter field.
After you edit twitter_template.json (like I said above), go delete your index pattern in Kibana dan twitter index in ElasticSearch, after that run again the Logstash
Proof:
Hi @andrioktavianto
Thanks for the feedback I get the same results as you "Discover" show now data.
In the dashboard I still get a error
Request to Elasticsearch failed: {"error":{"root_cause":[{"type":"illegal_argument_exception","reason":"Zero or negative time interval not supported"}],"type":"search_phase_execution_exception","reason":"all shards failed","phase":"query","grouped":true,"failed_shards":[{"shard":0,"index":"twitter","node":"0qsGH9ACT1y_KIPB3qXo9Q","reason":{"type":"illegal_argument_exception","reason":"Zero or negative time interval not supported"}}],"caused_by":{"type":"illegal_argument_exception","reason":"Zero or negative time interval not supported","caused_by":{"type":"illegal_argument_exception","reason":"Zero or negative time interval not supported"}}},"status":400}
I notice some field names in Dashboard is incorrect after fixing them it seems to work
e.g. Visualization: Followers histogram gives error Saved object is missing: Could not locate that index-pattern-field (id: author_followers_count)
I edited the visualization search for author_followers_count and replaced it with original_author.author_followers_count
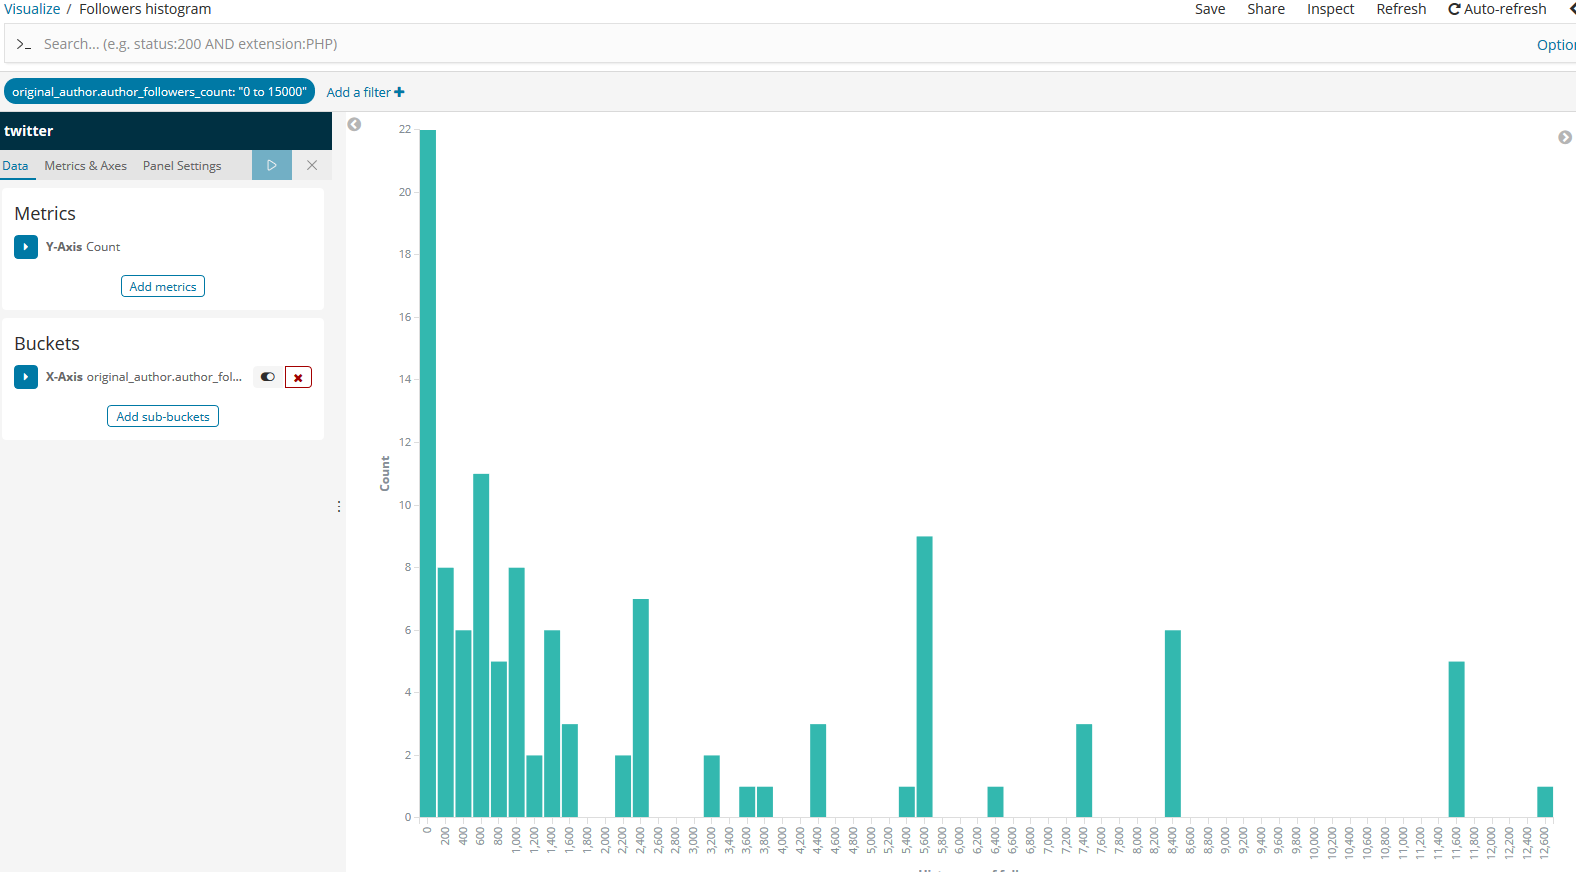
Will go throu all the the Visualization list and post my updates
Many thanks
Despite the above fixes, data still doesn't appear in the dashboard, probably because of change in Twitter's API. Each of the visualizations search for _type:tweet in the index, and this no longer exists. All objects seem to have _type:doc.
Use that and the visualizations will start getting populated.