pretty-traceback
 pretty-traceback copied to clipboard
Change Print Order?
Hi,
Thanks for this! Python backtraces have never made sense to me. I'd never had to think about it in other languages before, but the lack of colour and everything as you say, is pretty 🤮 , so grateful for this!
One thing that really messes my brain up is the order in which the lines are printed. Again, not had to think about it in other langs, it just seems to make sense, so it's somewhat hard to put my finger on why they have always looked terrible by default, when I can't put my finger on why they haven't in other languages. But I think printing the most recent call last is annoying, because if I have logging or other print output, I now need to scroll down to find what the problem is, then scroll up to see what just happened, then go back down, etc. Add in an exception thrown by another handler an I completely lose the plot. It seems to go up then down then up then down. The line that threw the next exception is a long way from the line that threw the first, which is a way from what happened just before.
Would there be any possibility of being able to configure the trace to print with the most recent call first? I took a basic look at the code a couple of weeks ago and am not sure if this would be limited by the internals of the traceback package or something similar. I believe Python has a reason for doing it this way, but to me it just makes a lot more sense to see a call stack as I'd be used to seeing in a native-code debugger - start at the top with the most relevant thing, then go down. Below, an example from cpptrace:
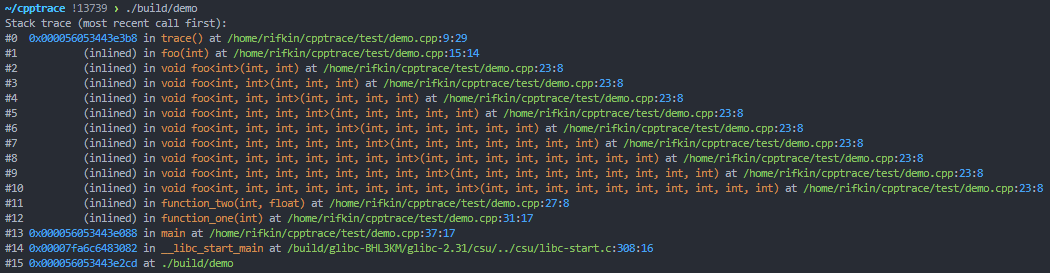 just by way of comparison.
Just looks a lot nicer to me. I see what happened just before the error, next to what caused it, and then I go down the stack to see the history. The fact I started from main isn't that useful at the top!!
Thanks!