tmplot
 tmplot copied to clipboard
Visualization of Topic Modeling Results
tmplot


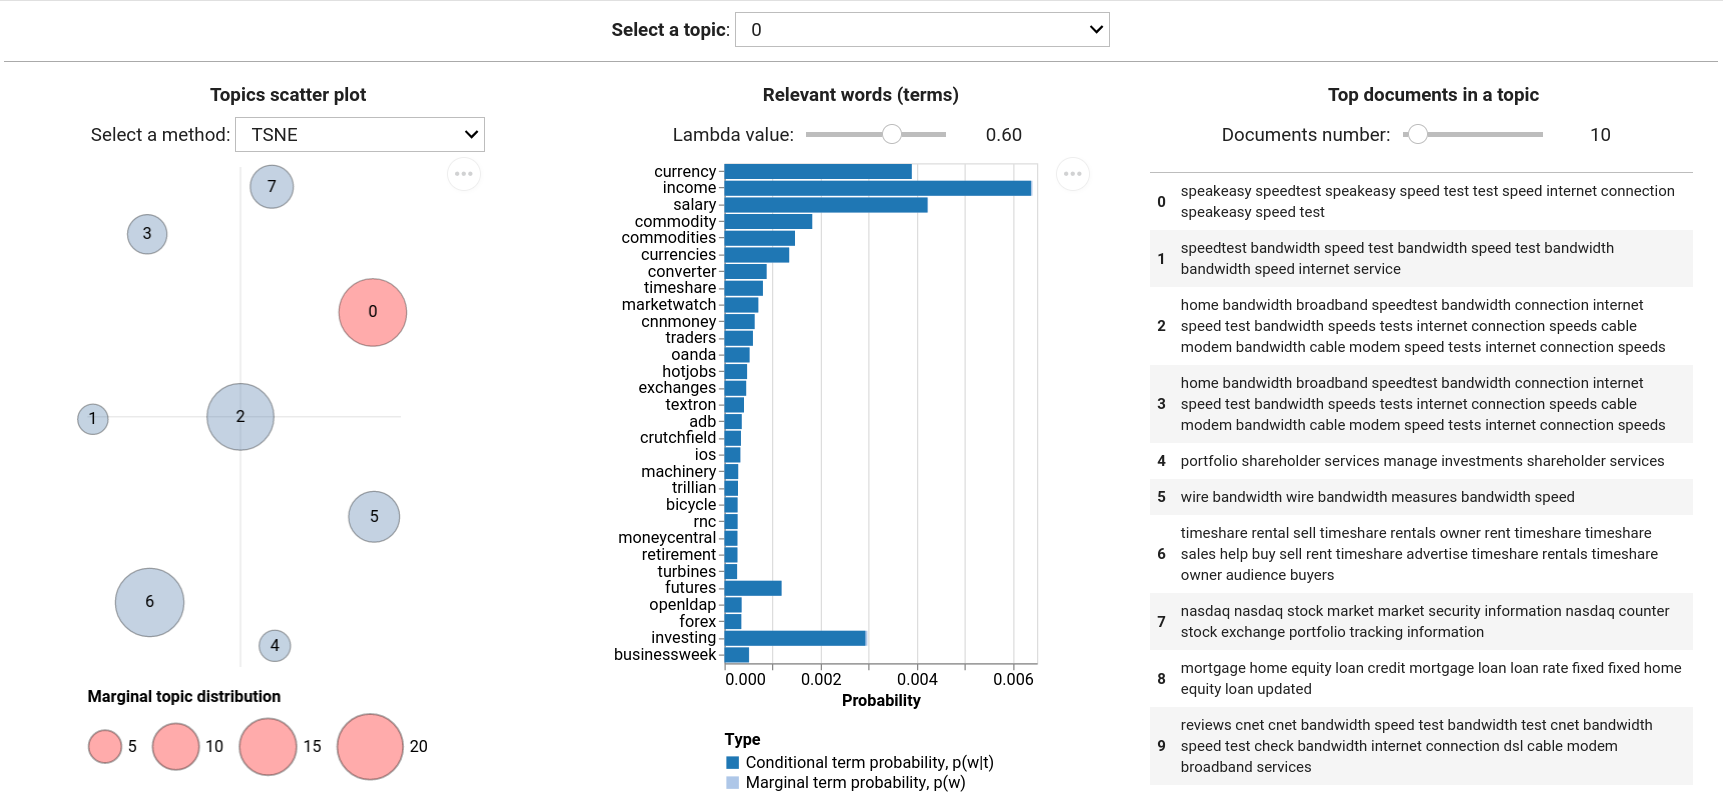
tmplot is a Python package for analysis and visualization of topic modeling results. It provides the interactive report interface that borrows much from LDAvis/pyLDAvis and builds upon it offering a number of metrics for calculating topic distances and a number of algorithms for calculating scatter coordinates of topics. It can be used to select closest and stable topics across multiple models.
Features
-
Supported models:
- tomotopy:
LDAModel,LLDAModel,CTModel,DMRModel,HDPModel,PTModel,SLDAModel,GDMRModel - gensim:
LdaModel,LdaMulticore - bitermplus:
BTM
- tomotopy:
-
Supported distance metrics:
- Kullback-Leibler (symmetric and non-symmetric) divergence
- Jenson-Shannon divergence
- Jeffrey's divergence
- Hellinger distance
- Bhattacharyya distance
- Total variation distance
- Jaccard inversed index
-
Supported algorithms for calculating topics scatter coordinates:
- t-SNE
- SpectralEmbedding
- MDS
- LocallyLinearEmbedding
- Isomap
Donate
If you find this package useful, please consider donating any amount of money. This will help me spend more time on supporting open-source software.

Installation
The package can be installed from PyPi:
pip install tmplot
Or directly from this repository:
pip install git+https://github.com/maximtrp/tmplot.git
Dependencies
numpyscipyscikit-learnpandasaltairipywidgetstomotopy,gensim, andbitermplus(optional)
Quick example
# Importing packages
import tmplot as tmp
import pickle as pkl
import pandas as pd

# Reading a model from a file
with open('data/model.pkl', 'rb') as file:
    model = pkl.load(file)

# Reading documents from a file
docs = pd.read_csv('data/docs.txt.gz', header=None).values.ravel()

# Plotting topics as a scatter plot
topics_coords = tmp.prepare_coords(model)
tmp.plot_scatter_topics(topics_coords, size_col='size', label_col='label')

# Plotting terms probabilities
terms_probs = tmp.calc_terms_probs_ratio(phi, topic=0, lambda_=1)
tmp.plot_terms(terms_probs)

# Running report interface
tmp.report(model, docs=docs, width=250)
You can find more examples in the tutorial.