mplfinance

mplfinance copied to clipboard
How can I remove y axis ticker
by setting datetime_format='' " i remove tickers on X axis. how can i do the same to the y axis? like in matplotlib plt.yticks([])
Depending exactly what you want to accomplish, you can try one of the following:
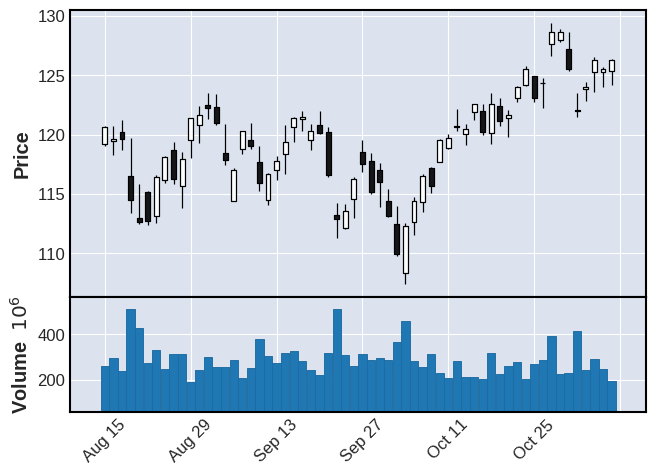
Given the following plot:
mpf.plot(df,type='candle',volume=True)
- Use kwarg
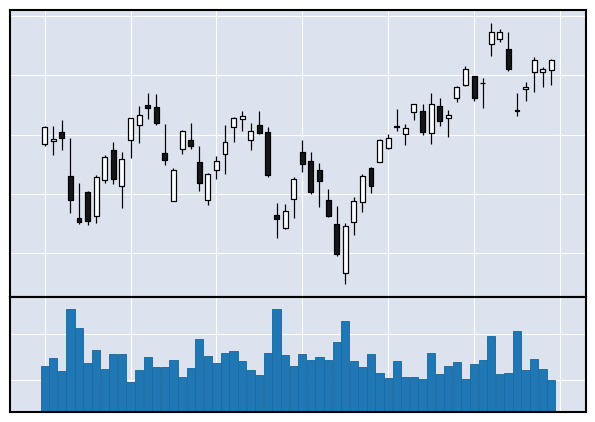
axisoff=Trueto accomplish the folowing:
mpf.plot(df,type='candle',volume=True,axisoff=True)

- Or use
returnfig=TrueandAxes.set_[xy]ticklabels()to accomplish the following:
fig, axlist = mpf.plot(df,type='candle',volume=True,returnfig=True)
axlist[0].set_xticklabels([])
axlist[0].set_yticklabels([])
axlist[2].set_yticklabels([])
mpf.show()

- or alternatively:
fig, axlist = mpf.plot(df,type='candle',volume=True,returnfig=True)
axlist[0].set_xticklabels([])
axlist[0].set_yticklabels([])
axlist[0].set_ylabel('')
axlist[2].set_yticklabels([])
axlist[2].set_ylabel('')
mpf.show()
- If you are not familiar with
returnfig=Trueclick here - If you are working inside jupyter notebook, then replease
mpf.show()with simplyfig
To remove the tickers on the y-axis, tick_params() method has an attribute named left and we can set its value to False and pass it as a parameter inside the tick_params() function. It removes the tick on the y-axis.