feature request: lines linking points to underlying raster
This is a super cool project, and something that I've always wanted to see in rstats. Thank you for thinking of this!
Take the following with a grain of salt and only if you are inspired by it, or see it as useful. Otherwise, feel free to close the issue.
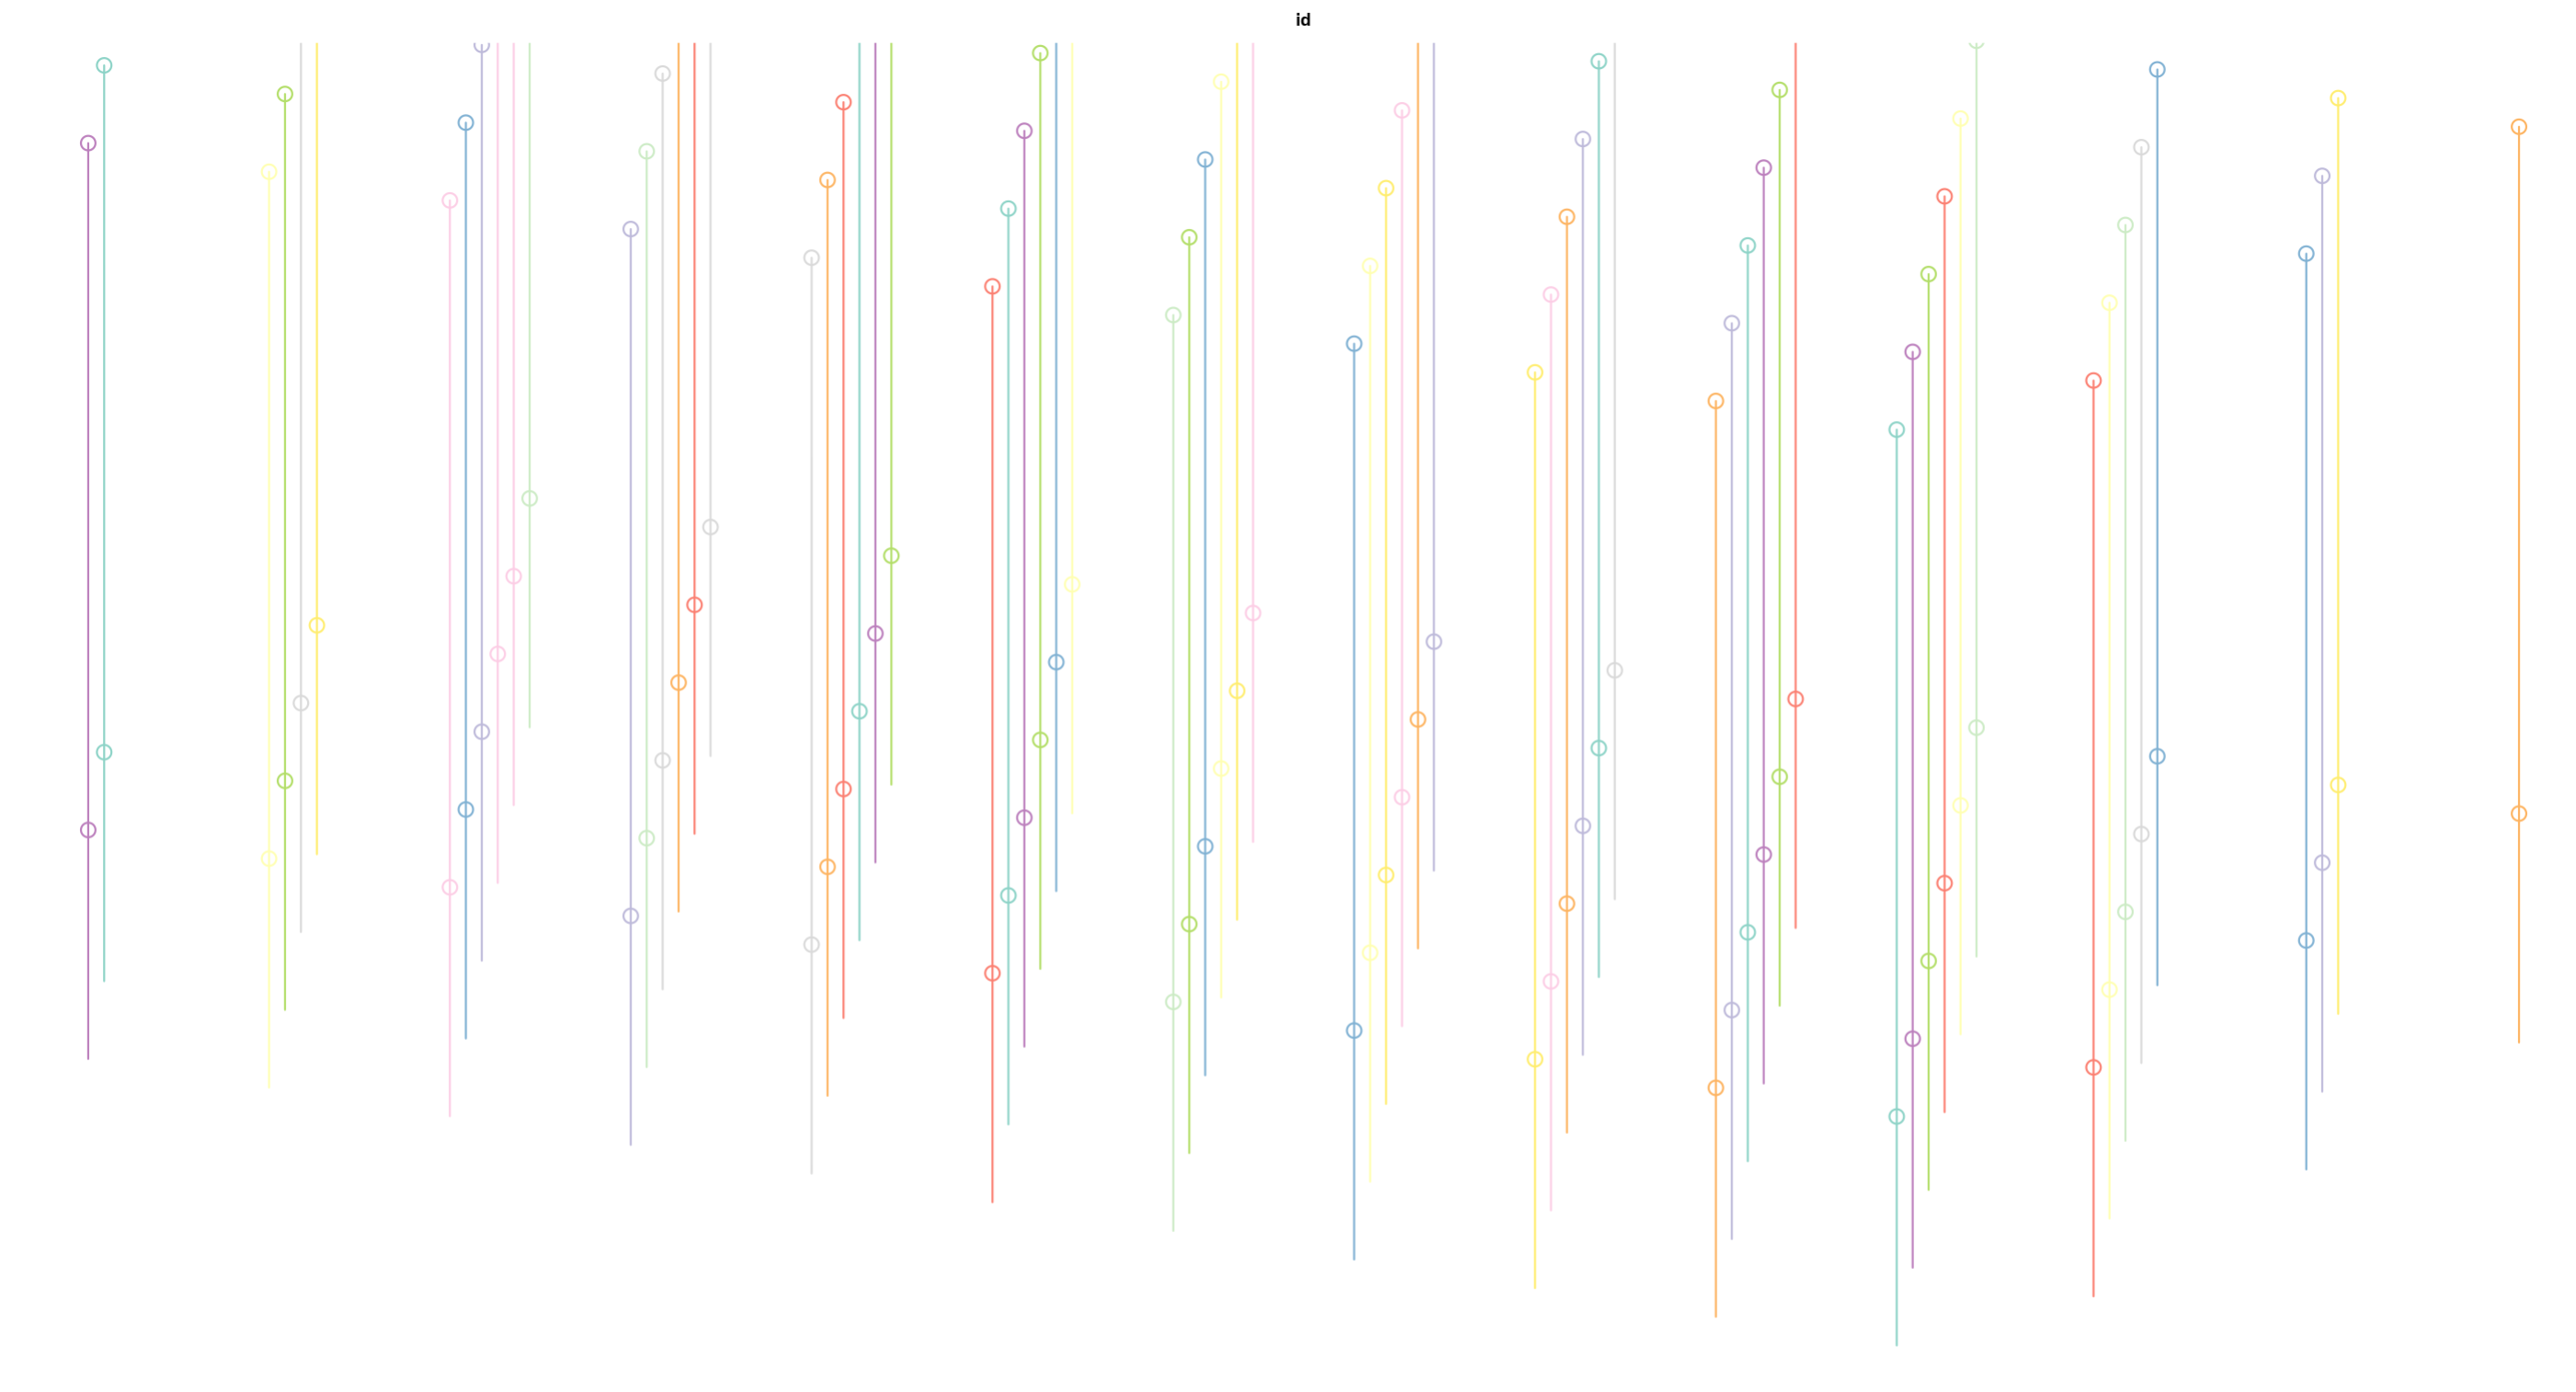
I'm wondering how difficult it would be to implement a feature to link points or polygon centroids to the underlying raster? Something like the following, but with lines for all points:

Thanks for your kind words!
Puh. I had the same idea at some point, but my brain was to lazy to come up with a good solution for that.
Since the spatial data itself is shifted, one had to give each feature an ID with respect to its original location. After the shifting one could come up with a line feature connecting the same ids and draw them with ggplot2?
Initial thought ... could be possible :D
Do you want to do this for single features or AOI, say a certain area shown as a rectangle?
Awesome!
I'm not sure how to implement the nitty-gritty details, but can imagine a feature like plot_tiltedmaps(map_list, connect_lines = TRUE) where by default lines are computed on-the-fly between features and the underlying raster.
Or to your point of constraining this to a set of features, perhaps plot_tiltedmaps(map_list, connect_lines = column) where column is a TRUE/FALSE column in the points or polygon dataframe that specifies if a line should be drawn for that feature.
Took some time, but:
tilt_keep_in_mind <- x %>% mutate(id = rownames(.))  %>% relocate(id)

tilt_keep_in_mind_1 <- tilt_map(tilt_keep_in_mind)
tilt_keep_in_mind_2 <- tilt_map(tilt_keep_in_mind, x_shift = 0, y_shift = 50)
tilt_keep_in_mind_3 <- tilt_map(tilt_keep_in_mind, x_shift = 50, y_shift = 100)

tilt_keep_lines_1 <- rbind(tilt_keep_in_mind_1, tilt_keep_in_mind_2) %>%
  group_by(value) %>%
  summarize(m = mean(value)) %>%
  st_cast("LINESTRING") %>%
  st_make_valid()
x was in my case the result of st_sample().
Produces:
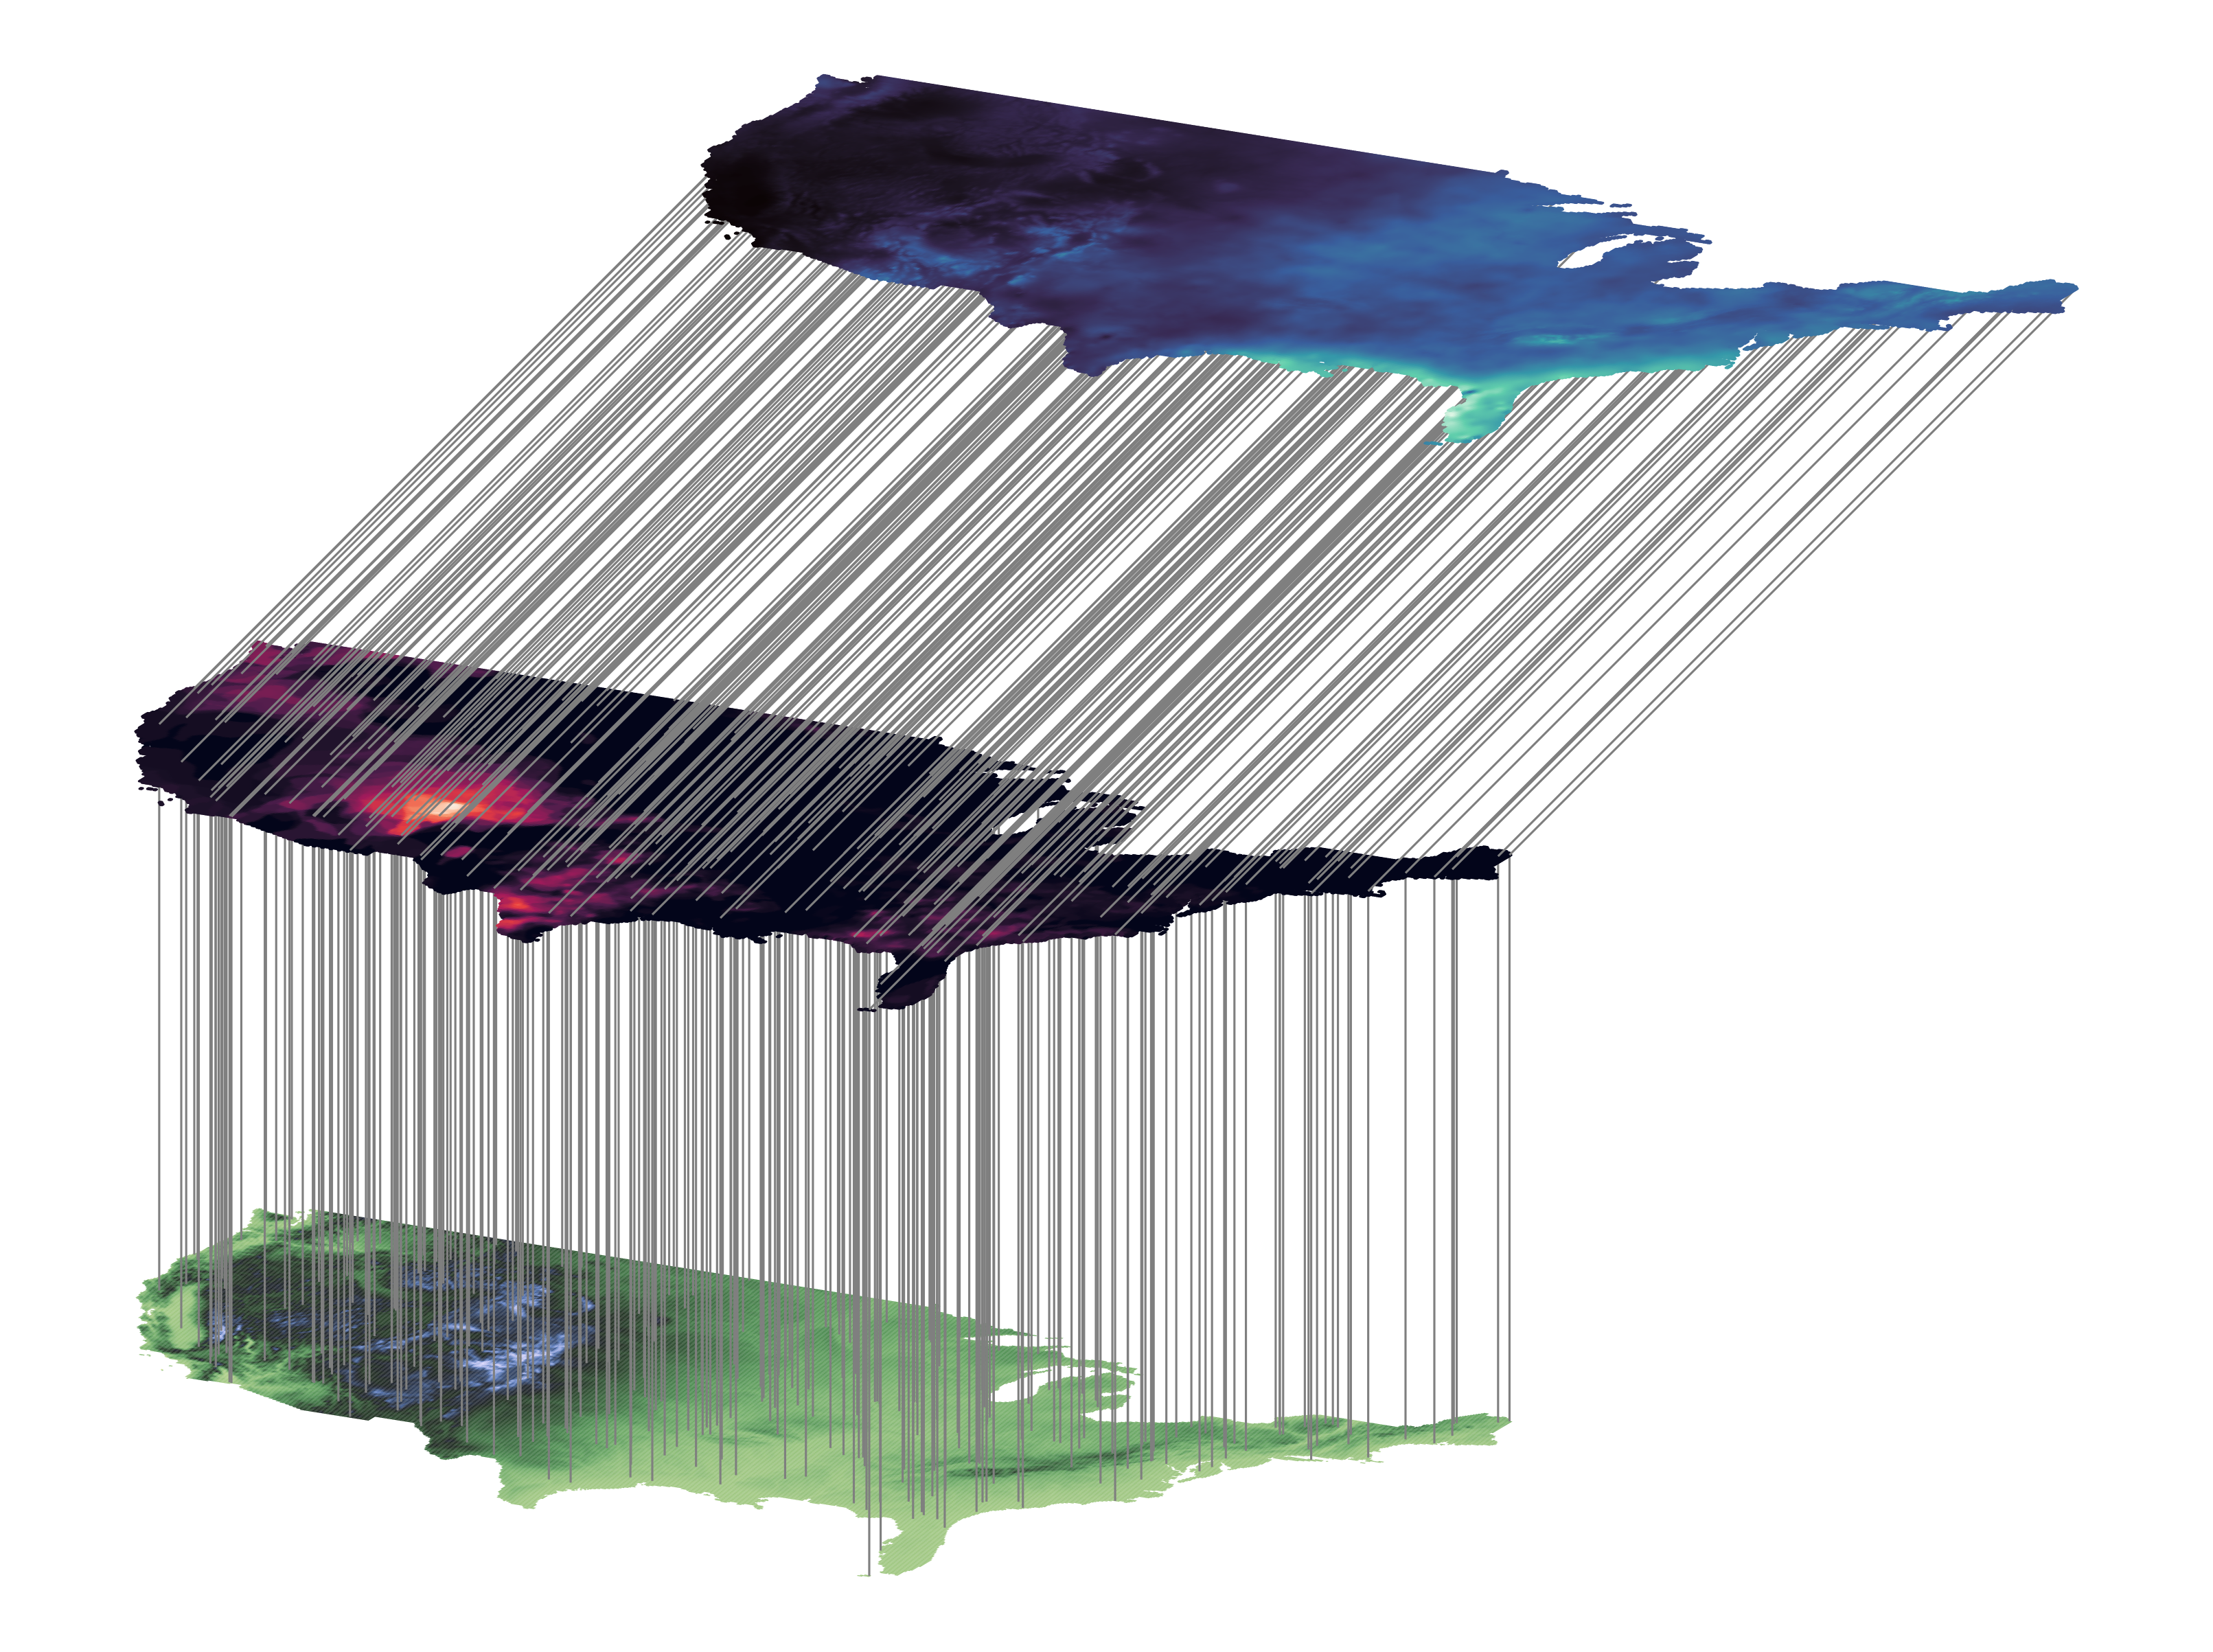
I get the feeling, that this is very ... cryptic. It really depends on what layer you want to connect where. I could try to put it in a function, or we come up with a good vignette. Any preferences @z3tt ?
Yes, here it is rather cryptic 😄 For me, a good use case would be to indicate a single or only a few points of interest, e.g. mountain peaks. I'd love to see a function and an example, maybe one illustrating it with only a few lines?