vedo
 vedo copied to clipboard
Scale bar
Hi Marco,
itkwidgets has a very nice scale bar functionality (see screenshot below, the number changes depending on how zoomed in you are), is there something similar in vedo?
I know that there's an axis option that shows a ruler at the bottom of the screen, but I could never quite figure out if it would work as a scale bar. Also in general I'd prefer something small like in the the screenshot.

I guess it would be possible to hack something like this using a 2d scale bar, but was wandering if you had already something set up for it.
To be clear: what I'd like is something that maps the length of a line in number of pixels in the window to what that corresponds to in the scene in terms of distance between two points. So I don't want a ruler that just shows the distance between two points. Say that the scalebar line is 100px long, if I'm very zoomed out that could be equal to a distance of 1000 between two points, but once I zoom in a lot the same line shows the distance betwee two points that are say 50 apart, makes sense?
Hi Federico, it makes sense! Except that one should keep in mind that such an indicator is meaningful only in parallel projection mode (not in perspective mode) . Indeed axes=13 should be disabled in perspective:
from vedo import *
c = Cylinder()
x0,x1,y0,y1,z0,z1 = c.bounds()
r = Ruler([x1+.1,y0,z0], [x1+.1,y1,z0], units='\mum')
show(c, r, axes=13) # 13=vtkLegendScaleActor
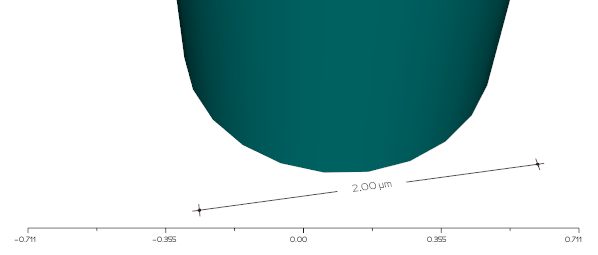
parallel:

I'll see if I can customize the https://vtk.org/doc/nightly/html/classvtkLegendScaleActor.html to make it similar to the itkwidget style.
Hey,
That makes a lot of sense, thanks. How can one switch between modes?
I guess this is what you mean... (right-click and drag to see it changing).. but I only went this far in implementing it..
import vtk
from vedo import *
settings.useParallelProjection=True
plt = Cube().alpha(0.2).show(axes=dict(xtitle='x (mm)'), interactive=0)


def scale_indicator():
    s = 0.02
    pos = (0.7,0.1)
    length = 2
    units = 1

    ppoints = vtk.vtkPoints()  # Generate the polyline
    psqr = [[0.0,0.04],[length/10,0.04]]
    dd = psqr[1][0] - psqr[0][0]
    for i, pt in enumerate(psqr):
            ppoints.InsertPoint(i, pt[0], pt[1], 0)
    lines = vtk.vtkCellArray()
    lines.InsertNextCell(len(psqr))
    for i in range(len(psqr)):
        lines.InsertCellPoint(i)
    pd = vtk.vtkPolyData()
    pd.SetPoints(ppoints)
    pd.SetLines(lines)

    rlabel = vtk.vtkVectorText()
    rlabel.SetText('test')
    tf = vtk.vtkTransformPolyDataFilter()
    tf.SetInputConnection(rlabel.GetOutputPort())
    t = vtk.vtkTransform()
    t.Scale(s,s,s)
    tf.SetTransform(t)

    app = vtk.vtkAppendPolyData()
    app.AddInputConnection(tf.GetOutputPort())
    app.AddInputData(pd)

    mapper = vtk.vtkPolyDataMapper2D()
    mapper.SetInputConnection(app.GetOutputPort())
    cs = vtk.vtkCoordinate()
    cs.SetCoordinateSystem(3)
    mapper.SetTransformCoordinate(cs)

    fractor = vtk.vtkActor2D()
    csys = fractor.GetPositionCoordinate()
    csys.SetCoordinateSystem(3)
    fractor.SetPosition(pos)
    fractor.SetMapper(mapper)
    fractor.GetProperty().SetColor(0,0,0)
    fractor.GetProperty().SetOpacity(1)
    #fractor.GetProperty().SetLineWidth(2)
    fractor.GetProperty().SetDisplayLocationToForeground()

    plt.renderer.AddActor(fractor)
    def func(iren, ev):
        wsx, wsy = plt.window.GetSize()
        ps = plt.camera.GetParallelScale()
        newtxt = utils.precision(ps*units/wsy*wsx*length*dd,3)+' mm'
        rlabel.SetText(newtxt)
        #t.Scale(.1,1,1)
        plt.interactor.Render()

    plt.interactor.AddObserver('InteractionEvent', func)
    plt.interactor.Render()
    return fractor

scale_indicator()

interactive()

there are a number of issues which seem difficult to solve. I'll keep this open in case i come up with a reasonable solution..
Hey,
thanks for giving it a shot. That looks like it's exactly what I had in mind, what are the issues?
what are the issues?
many :)
- the wheel does not trigger an interaction
- the mapper seems to render badly the polygonal text
- merging the polydatas is probably a bad idea because I cannot then modify the width of the line
Only after 2 years... there it is :)
from vedo import settings, Cube, Plotter
settings.useParallelProjection = True
cube = Cube().alpha(0.2)
plt = Plotter(size=(900,600), axes=dict(xtitle='x (um)'))
plt.addScaleIndicator(units='um', c='b4')
plt.show(cube, "Scale indicator with units")
