vedo
 vedo copied to clipboard
masking some cells/ facets while using cellColors
Hi again,
I've been trying to use the scalebar and cellColors() to visualise facet-based data and have come across this problem. I have a DTM for which I have a list of values each of which maps to a facet ID. So in theory I could visualise the DTM based data. However within this list I also have facets to which there are no values / data to be shown, which I have by default set to 0.
However, when I showcase the data and put a scalebar in the side, I'm not able to just show only the facets to which I have the data. Since the undesired facets are set to 0., they also appear coloured and makes the visualisation a bit misleading. I tried to use argument 'alpha' to set the transparency, but it leads to loosing information about the terrain on the DTM where there are no values. So I'm not sure how to deal with this issue. Sometimes I have values that range from -1 through 2 for the facets, and as such, setting values to 0. will be misleading the visualisation itself. So I'm wondering whether there is a way to still show the coloured facets, but only show the mesh for the undesired facets (those that I'm setting to 0.), while preserving the terrain info.
I do not know if I made myself clear. Please let me know if it's not clear or you need more information.
Thank you in advance !
You can try by marking the specific cells for deletion (you might want to make a copy with mesh.clone() if needed):
from vtkplotter import *
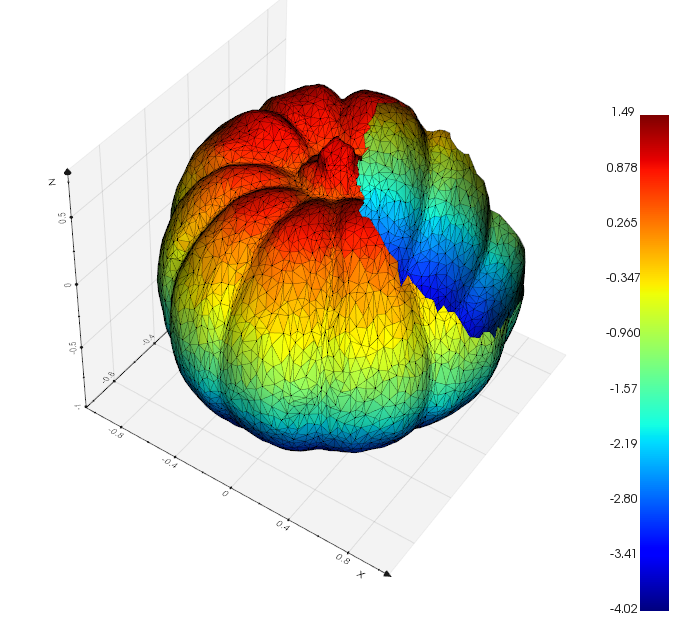
pu = load(datadir+'pumpkin.vtk').lw(0.1)
# make up some scalar value
scals = pu.cellCenters()[:,2]*3 -1
# get a bunch of points close to [1, 0.5, 1]
ids = pu.closestPoint([1, 0.5, 1], N=800, returnIds=True)
# delete points and cells by their ids
pu.deletePoints(ids).cellColors(scals).addScalarBar()
show(pu, axes=1, viewup='z')
I forgot that this script could also be relevant.
Thanks for the quick response. I'm actually working with cells / faces. It seems that there is no equivalent function to delete cells off a mesh within the library (deleteCells ?). So I wanna find a way to get the points corresponding to the set of cells/ faces that I wanna delete ?
or ideally what I'm after is just to keep the skeleton / cells without any colouring (defined by a cell / face ID) for a given / specified list of cells. This is to give a visual of the surface structure of the cells, for which there will be no data to be displayed.
In other words, as per the pumpkin example, I would prefer to have the empty cells without any colours so that the surface structure is visible. I've tried to play with the alpha keyword and it just makes the cells disappear (when set to 0. ) as if you were to have them deleted. Sorry for the repeated questions or if I sounded confusing. I'm new to this library and just trying to how I can get done what I want.
Thanks again !
what about ovelapping the same wireframe mesh (with optional scaling):
from vtkplotter import makeLUT, Sphere, show
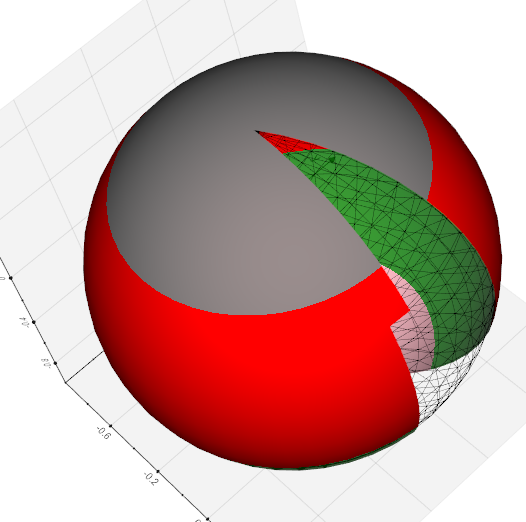
mesh = Sphere()
wmesh = mesh.clone().wireframe().lc('k').lineWidth(0.1)
wmesh.scale(0.99)
# create some data array to be associated to points
data = mesh.points()[:,2]
data[10:90] = float('nan')
# Build a lookup table of colors:
# scalar color alpha
lut1 = makeLUT([(-0.80, 'pink' ),
(-0.33, 'green', 0.8),
( 0.67, 'red' ),
],
vmin=-1, vmax=1,
aboveColor='grey',
belowColor='white',
interpolate=False,
)
mesh.pointColors(data, cmap=lut1).addScalarBar()
show(mesh, wmesh, axes=1, viewup='z')
Thanks again, this is a good idea to used a wired frame just underneath the mesh. It seems to work. But I have a one slight final problem with the colormap. I figured that you have set some of the data to be float('nan') so that they are transparent/ not considered by the colormap. Since this is a custom colormap I'm not sure how to do it with a standard matplotlib color map, say 'viridis' for example ?
In this case you don't need makeLUT
from vtkplotter import *
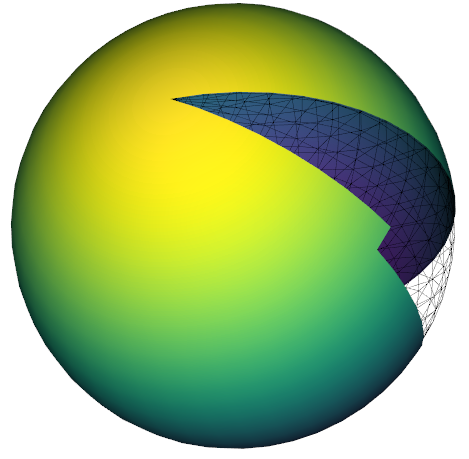
mesh = Sphere()
wmesh = mesh.clone().wireframe().lc('k').lw(0.1)
wmesh.scale(0.99)
data = mesh.points()[:,2]
data[10:90] = float('nan')
mesh.pointColors(data, cmap='viridis').addScalarBar()
show(mesh, wmesh)
well, I'm working with facets as I have to display facet-based data. So it seems that this does not work for facets, because in the way the properties of points and cells differ in vtkplotter ?
from vtkplotter import *
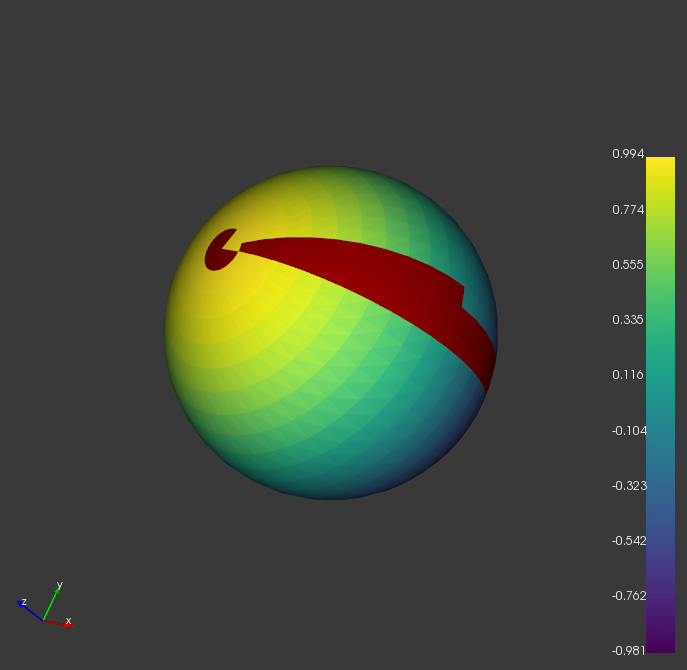
mesh = Sphere()
wmesh = mesh.clone().wireframe().lc('k').lw(0.1)
wmesh.scale(0.99)
data = mesh.cellCenters()[:,2]
data[10:200] = float('nan')
mesh.cellColors(data, cmap='viridis').addScalarBar()
show(mesh, wmesh)
As seen in the attached image, using cell-based coloring unfortunately leads to a maroon color facets for the 'nan'-valued cells.
well, finally I managed to get it solved by getting an array of facets mapping to their vertices using mesh.faces() though which I could find the 'points' that needed to be deleted and by eventually deleting them by calling deletePoints(). However I think there is much shorter way of doing that. I thought of posting this temporary solution, just in case someone like me runs into the same problem.
Thank you again for quickly reacting and helping out.
Thanks @ifermion - in the meanwhile i'll try to figure out why the nan trick is not working for cells..