Incorrect GPU usage
GPU usage seems to almost always be at 0%. occasionally it'll say like 5% or something, but it's usually at 0%, even while playing a heavily demanding game. radeontop seems to provide, at least, a more believable gpu usage. Using latest version from AUR, running Manjaro on KDE Plasma


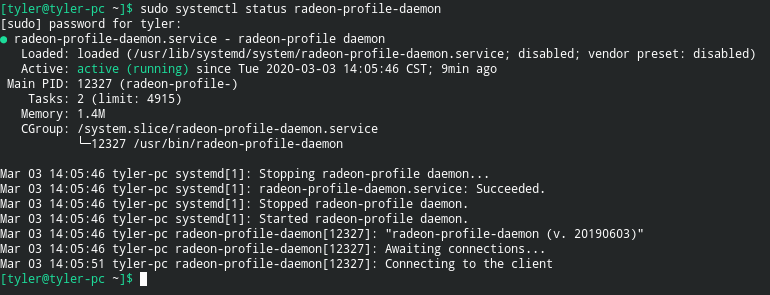
Two images taken not long after another, showing the extreme discrepancy of gpu usage compared to radeontop, which I've found to show relatively seemingly accurate gpu usage. These were taken today, after installing the latest from the AUR including the daemon (which is running)
While you have both RadeonTop and Radeon-profile running, could you check the value in gpu_busy_percent. Just go under /sys/class/drm/card0/device and "cat gpu_busy_percent" at repetition. That way, we will see if the problem comes from Radeon-profile or from the value reported by the amdgpu module.
From what I can see on my system, Radeon-profile and the value in gpu_busy_percent are very similar. However, RadeonTop is giving me a different value that doesn't fit with gpu_busy_percent.
Mine is the same as what you said, radeontop is dissimilar to gpu_busy_percent which is similar to Radeon Profile. Trying to capture gpu_busy_percent and Radeon-profile at the same value is difficult but watch -n 0.1 cat /sys/class/drm/card0/device/gpu_busy_percent is relatively in line with what Radeon-profile displays, and neither show anything similar to what Radeontop reports. However, gpu_busy_percent, when reporting faster like that it makes more sense. I figure doing something like gathering gpu_busy_percent over x interval and averaging it might provide a similar value to Radeontop.
Edit: Sure enough, gathering busy percent and then averaging it out reports numbers very close to Radeontop. Here's a rudamentary shell script I made that does so. The higher COUNT is, the more accurate the result becomes.
#!/bin/sh
COUNT=120 #number of times to read usage. 120 is default

WAIT=`echo 1/$COUNT | bc -l` #calculate wait time
USAGE=0 #do not change this
for ((n=0;n<$COUNT;n++))
do
    USAGE=`expr $USAGE + $(cat /sys/class/drm/card0/device/gpu_busy_percent)`
    sleep $WAIT
done
USAGE=`expr $USAGE / $COUNT`
echo Estimated GPU usage: $USAGE%
EDIT 2: refined code as per Oxalin's suggestion. Now more accurate and less hardcoded
doing watch -n 0.1 sh script.sh can then provide a live preview of the value.
A few notes:
- Radeontop creates 120 samples / sec. You could change the first sleep for "sleep 0.0083"
- After testing your code, my result is closer to radeon-profile than to radeontop. I would have to look at radeontop's code.
120 samples/second? Ill give that a looksie, see how close it is to Radeontop on my system. There were moments, when comparing the values side-by-side with yakuake, that my script would be wildly dissimilar to radeontop, but the next I guess "refresh" would bring radeontop to the value that seemed not to match it - almost like radeontop sometimes is a second behind. Could also just be inaccuracies/bad luck with grabbing values from gpu_busy_percent and averaging them (for example, occasionally just grabbing a bunch of zeroes and missing the busy times)
On radeon-profile, for my system, it never seems to report an average usage, more that it just grabs whatever value is in gpu_busy_percent every second. Now, this is just a logical guess, but from what Im seeing, it seems like gpu_busy_percent is almost too real-time to grab from once a second. Something like gathering the tiniest fluctuations in usage (so at any moment the gpu being i.e. 0% busy rendering something that one second you grabbed it while in reality you dont actually have 100% of your gpu free to utilize because the next second it jumps it to like 100%). So radeon-profile reports tend to be something like 0% one second, 100% the next, 20% the next, and so on - random values that dont really add up to much. Im curious as to how yours is, and whether or not its a problem with my system only.
Edit: After finally getting around to giving the change you recommended a shot, I've found it to be a bit more accurate, however there is still a relative disconnect between this method and Radeontop's value. On the plus side, this script's value doesn't report random 0% usages or anything, and seems to give a fairly believably accurate value, as it's rarely ever very far from radeontop's
I might try to fix the getGpuUsage in ioctHandler, submit a PR, sometime in the near future. Have school to focus on atm, and I gotta figure out how exactly Id want to go about it. Unless someone gets to it before me, in which case radical. Does look like, whatever its doing, its doing it with a frequency of 150, though I dont quite understand how the current one works exactly, I cant really see how it gets gpu usage at all. My knowledge is limited though, of course.