capa
 capa copied to clipboard
Published
20 hours ago •
 mandiant
capa explorer: get stuck in the debugger
Description
The explorer seem to get stuck when running it in the debugger, while it runs fine when the debugger is not running. This can make IDA crashing.
Steps to Reproduce
- Load 7d7b40fbe3d6bf1a8c04d9220b583acfe1c7a30fc91782f8e226b65f882f095c intro IDA
- Start the debugger
- Open the explorer plugin and press analyze
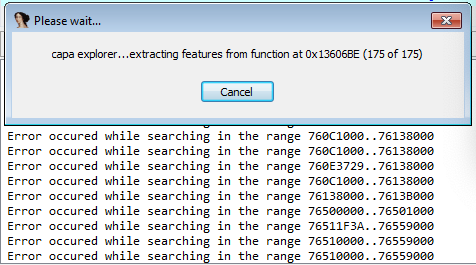
- You will notice it gets stuck with the following message:
capa explorer...extracting features from function 0x13606BE (175 of 175). PressingCancellog error messages in the console. To continue using IDA (and close the explorer), you need to pressCancelmaaany times - If you don't cancel and wait for some minutes, it will eventually finish and show correct results
Expected behavior:
- The
Cancelbutton, stop the analysis immediately and allow me to continue using IDA - capa explorer analysis is as fast in the debugger as outside of it
Actual behavior:
The explorer takes longer to run in the debugger and it is not possible to cancel.
Versions
master
Additional Information
I think it is not a very recent issue, as I think I had it before (so nothing that should block the release as it is probably not a regression).
I recently encountered this issue with a sample that contained 18k+ functions (without debugger running). Therefore, I'm unsure whether this issue is correlated to the debugger or is instead a resource issue? More investigation to come.