kasa-collector
 kasa-collector copied to clipboard
Kasa Collector provides a way of collecting real-time energy data from Kasa Smart Plugs. These Grafana dashboards offer visualizations for their Current, Voltage, Power, and Total Watt Hours.
About The Project

Kasa Collector is a set of scripts deployed with Docker that provide a way of collecting data from Kasa Smart Plugs. Once deployed, you can use Grafana dashboards to start visualizing that data.
A live set of dashboards using this Collector are available for you to try out.
Getting Started
The project builds a pre-configured Docker container that takes different configurations based on how often you wish to poll your Kasa devices.
Prerequisites
Supported Kasa Smart Plugs
This project currently supports collecting data from the Kasa KP115 smart plug device and Kasa HS300 power strip.
TPLink Smartplug Open Source Project
The underlying Python script that is used to communicate with the Kasa devices by the Kasa Collector comes from the softScheck tplink-smartplug project. An overview on how they reversed engineered getting access to the local devices is available.
Deploying Kasa Collector
Use the following Docker container:
lux4rd0/kasa-collector:1.0.1
lux4rd0/kasa-collector:latest
Kasa Collector requires environmental variables for the container to function. It mainly needs to have details on your InfluxDB instance (URL, username, and password) and the list of Kasa devices you'd like for it to poll.
You can start the container with something simliar to the example docker-compose.yml file:
services:
  kasa-collector:
    container_name: kasa-collector
    environment:
      TZ: America/Chicago
      KASA_COLLECTOR_COLLECT_INTERVAL: 5
      KASA_COLLECTOR_DEVICE_HOST: kasa-device01.lux4rd0.com,kasa-device02.lux4rd0.com
      KASA_COLLECTOR_HOST_HOSTNAME: kasa-collector.lux4rd0.com
      KASA_COLLECTOR_INFLUXDB_PASSWORD: none
      KASA_COLLECTOR_INFLUXDB_URL: http://influxdb01.lux4rd0.com:8086/write?db=kasa
      KASA_COLLECTOR_INFLUXDB_USERNAME: none
    image: lux4rd0/kasa-collector:latest
    restart: always
version: '3.3'
Or use this example docker run command:
docker run -d \
      --name=kasa-collector \
      -e KASA_COLLECTOR_COLLECT_INTERVAL=5 \
      -e KASA_COLLECTOR_DEVICE_HOST=kasa-device01.lux4rd0.com,kasa-device02.lux4rd0.com \
      -e KASA_COLLECTOR_HOST_HOSTNAME=kasa-collector.lux4rd0.com \
      -e KASA_COLLECTOR_INFLUXDB_PASSWORD=none \
      -e KASA_COLLECTOR_INFLUXDB_URL=http://influxdb01.lux4rd0.com:8086/write?db=kasa \
      -e KASA_COLLECTOR_INFLUXDB_USERNAME=none \
      -e TZ=America/Chicago \
      --restart always \
      lux4rd0/kasa-collector:latest
Be sure to change your the InfluxDB details, timezone, and list of Kasa devices in the environmental variables.
Running docker-compose up -d or the docker-run command will download and start up the kasa-collector container.
Environmental Flags:
Kasa Collector may be configured with additional environment flags to control it's behaviors. They are described below:
KASA_COLLECTOR_COLLECT_INTERVAL - OPTIONAL
How frequently the Collector polls your devices to collect measurements in seconds. Defaults to 1 (second) if it's not set.
- integer (in seconds)
KASA_COLLECTOR_DEBUG - OPTIONAL
Outputs additional logging. Defaults to false.
- false
- true
KASA_COLLECTOR_DEBUG_CURL - OPTIONAL
Outputs additional logging specific to the curl commands to persist data to InfluxDB. Defaults to false.
- true
- false
KASA_COLLECTOR_DEBUG_SLEEPING - OPTIONAL
Outputs additional logging specific to when the Collector is sleeping between polling. Helpful if you'd like to see if the Collector is doing something. Defaults to false.
- true
- false
KASA_COLLECTOR_DEVICE_HOST - REQUIRED
The hostname of your supported Kasa devices. If you have more than one, list them separated by a comma.
KASA_COLLECTOR_HOST_HOSTNAME - OPTIONAL
This value represents the hostname that is running the Docker container. Docker creates a unique hostname each time a docker container is recycled. This entry is used in the Collector Info dashboard to know where the Collector is running.
KASA_COLLECTOR_INFLUXDB_PASSWORD - REQUIRED
The password to your InfluxDB database instance.
KASA_COLLECTOR_INFLUXDB_URL - REQUIRED
The URL is required to persist data to InfluxDB. An example would be: http://influxdb:8086/write?db=kasa
KASA_COLLECTOR_INFLUXDB_USERNAME - REQUIRED
The username to your InfluxDB database instance.
Collector Details
kasa-collector
Kasa Collector is the primary data collector and is responsible for gathering details per Kasa device for the following:
- Current (milliamps)
- Voltage (millivolts)
- Power (milliwatts)
- Total Watt Hours
Additional details like Wifi RSSI signal strength, device and plug names, and device details are also collected.
Grafana Dashboards
Collecting data is only half the fun. Now it's time to provision some Grafana Dashboards to visualize all of your essential Kasa data. You'll find a folder of dashboards with collectors and backends split out. You can also use the links/numbers next to each dashboard title to load the dashboards in directly from Grafana.
In General:
Each dashboard has dropdowns at the top that provide for filtering of measurements based on devices and plugs. They default to "All," but you can certainly select and save preferences.
Interval: A dropdown that provides some different levels of smoothing helps manage how the graphs look based on the interval of data being collected by the Kasa Collector. Think of this as a level of "smoothing" based on the time frame you've chosen and the polling time that you're collecting data. Be sure to set these to a time frame that is higher than your poll rate.
Time Range: This defaults to "Today so far" but can be updated to any other Relative or Absolute time range. For longer time ranges, be sure to make changes to the "Interval" dropdown if you want to smooth out any of the data.
Dashboard Refresh: Each of the dashboards are set to refresh every sixty seconds. The refresh can be changed or disabled altogether.
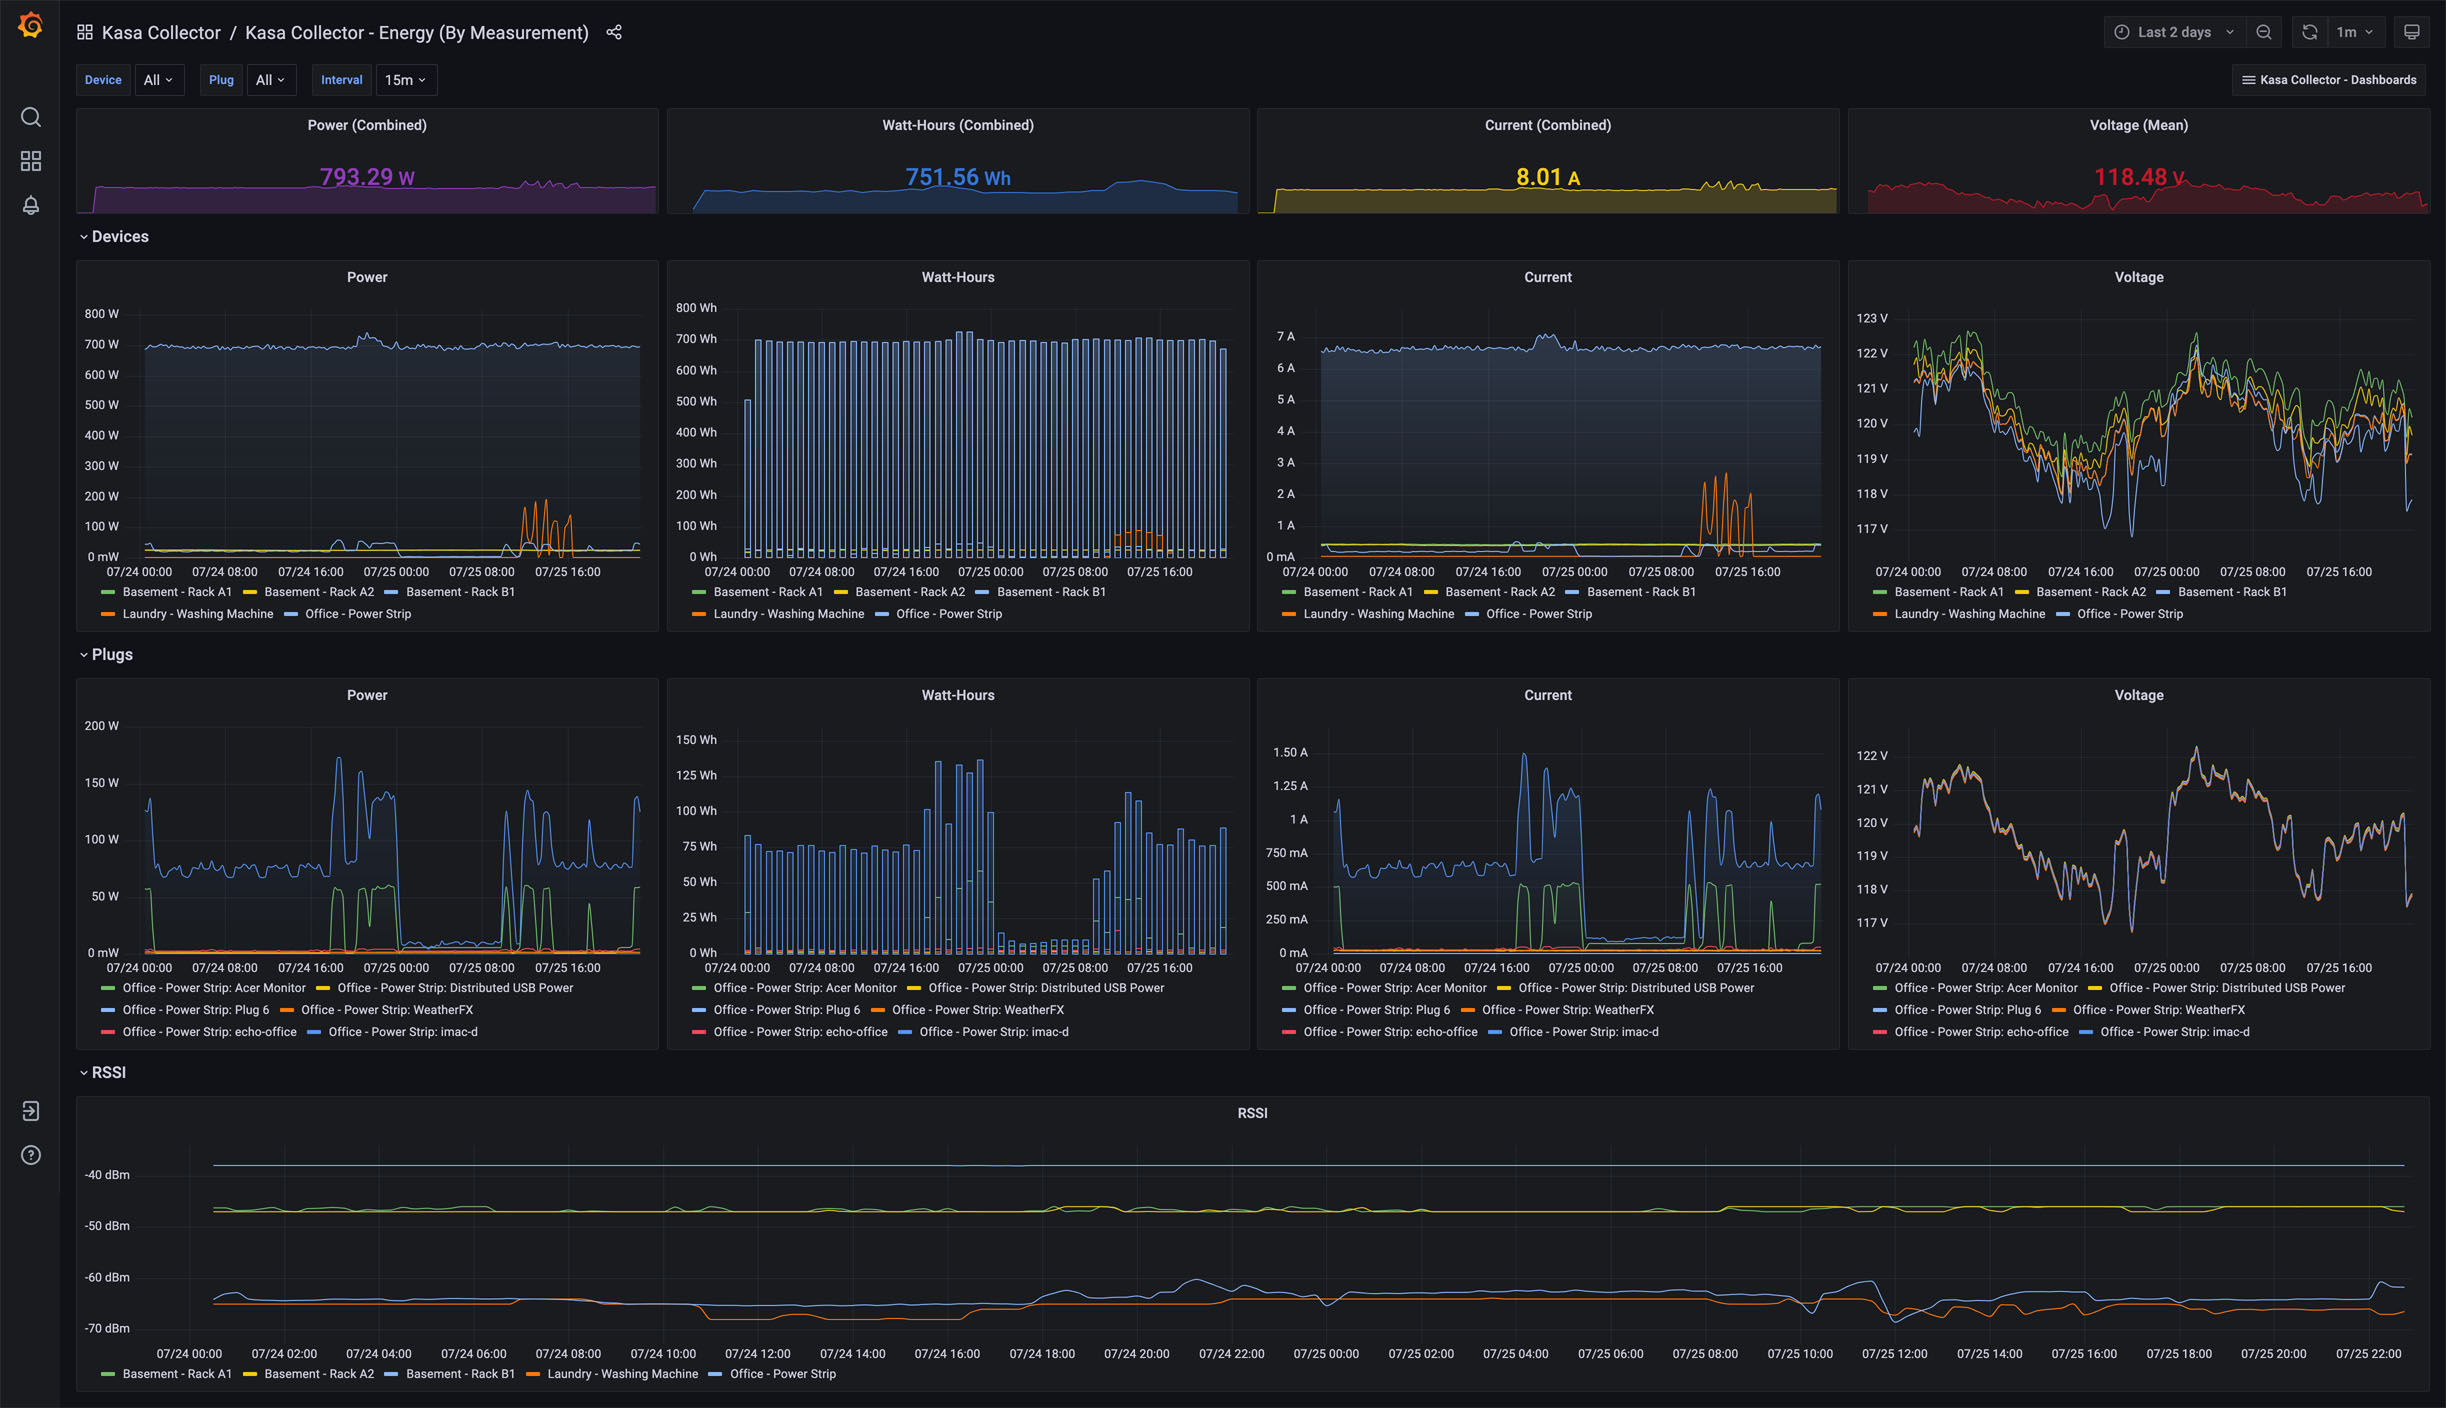
Kasa Collector - Energy (By Measurement) - 14762
Kasa Collector - Energy (By Device) - 14772
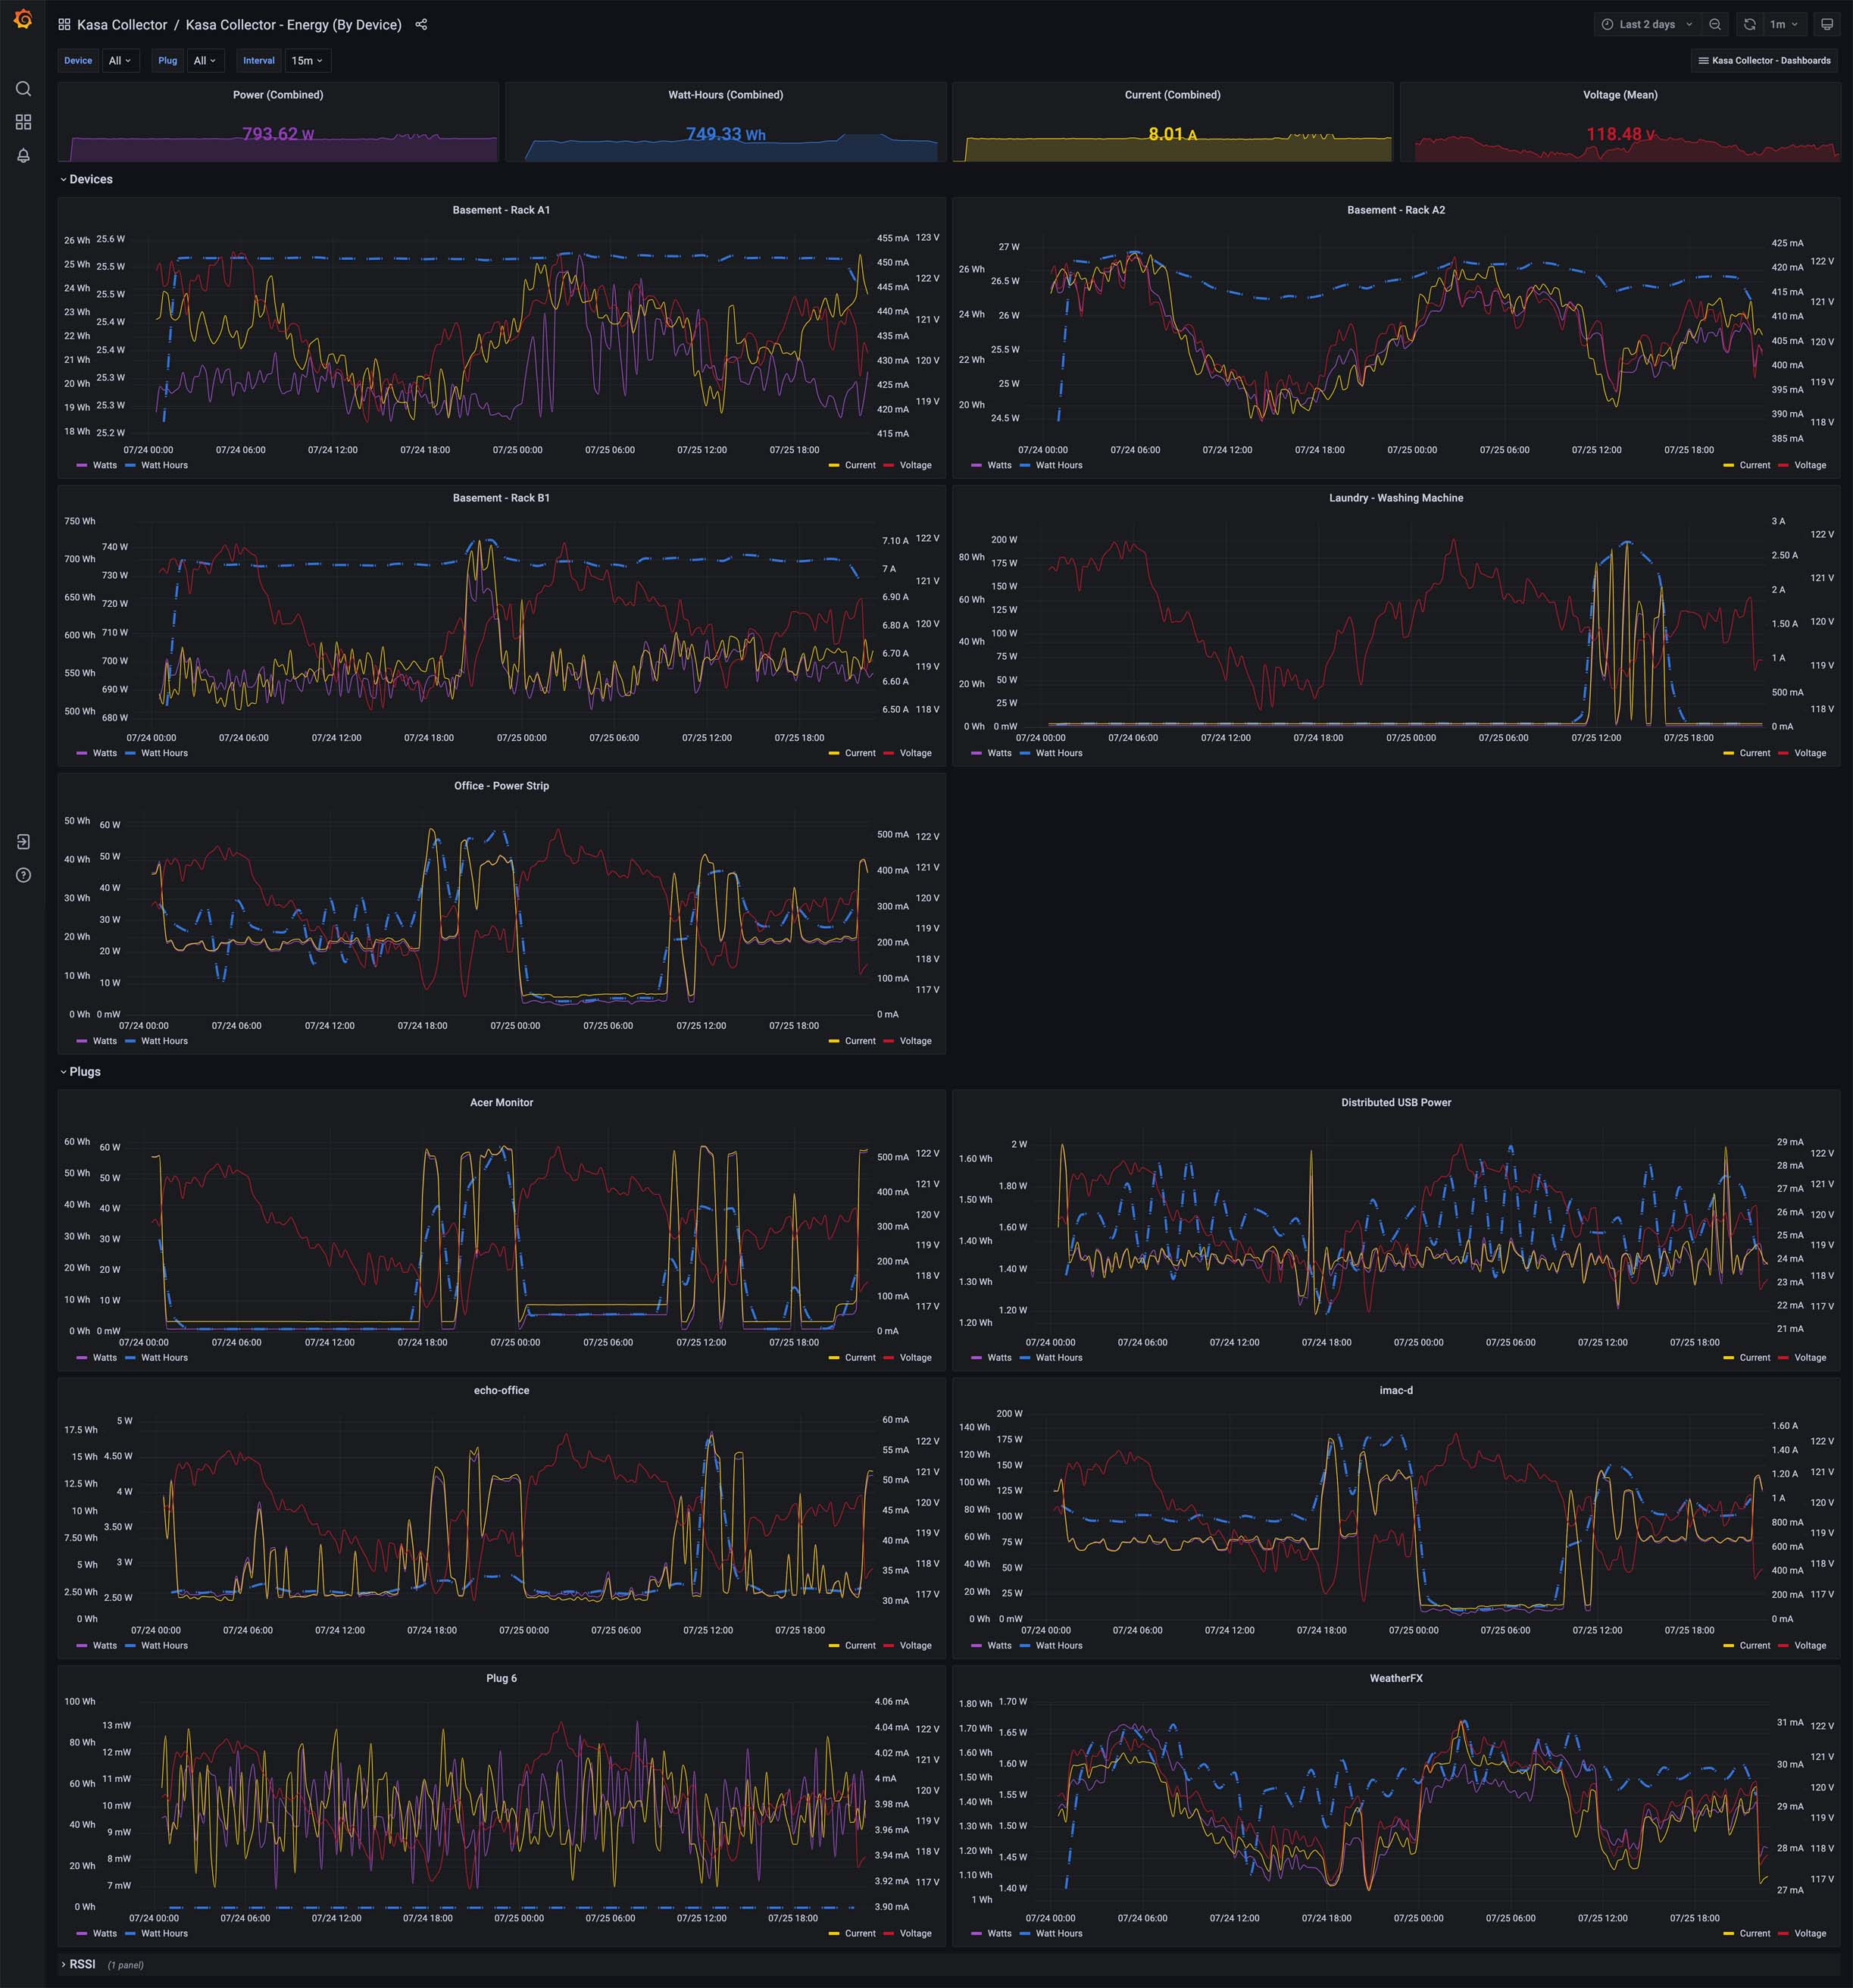
The Energy dashboard provides panels representing Power, Watt-Hours, Current, and Voltage. Measurements are represented at the top for total combined information (and voltage average) and rows for both devices and plugs (as part of power strips). You can use the device and plug dropdown menus at the top of the dashboard to filter on each. If you choose a single device that happens to be a power strip, only the plugs for that power strip will be shown in the Plugs dropdown.
Troubleshooting
Error Messages
Sometimes you'll see the following error message from the Kasa Collector:
kasa_request_info: malformed JSON, retrying
This is because some of the devices respond to the collector might be malformed data. The collector will try again until it receives a good response.
Roadmap
See the open issues for a list of proposed features (and known issues).
Contact
Dave Schmid: @lux4rd0 - [email protected]
Project Link: https://github.com/lux4rd0/kasa-collector
Acknowledgements
- Grafana Labs - https://grafana.com/
- Grafana - https://grafana.com/oss/grafana/
- Grafana Dashboard Community - https://grafana.com/grafana/dashboards/