evosuite-plus-plus
 evosuite-plus-plus copied to clipboard
A Visualization Solution for Debugging Graph-to-Code Generation
One important feature of EvoObj is that we shall generate a test template from an OCG, i.e., Object Construction Graph. A typical algorithm can be referred in Section 3.2 in our FSE'21 paper (http://linyun.info/publications/fse21.pdf).
Nevertheless, the debugging process is non-trivial. We need to typically observe the effect when traversing each graph node. Assuming the graph is huge (which can be possible in practice), it takes the huge effort.
Here, we need to create a facilitate to debug it. Typically, we would like to have a tool to visualize the process of synthesizing the test code from the graph. A demo can be checked by running feature.objectconstruction.testgeneration.testcase.ProjectGapGraphBasedCodeGenerationTest by setting generateCode(b, true, false);. It can generate a sequence of pictures, where each picture shows a time when we visit a node. Here, we need to debugging facility as follows:
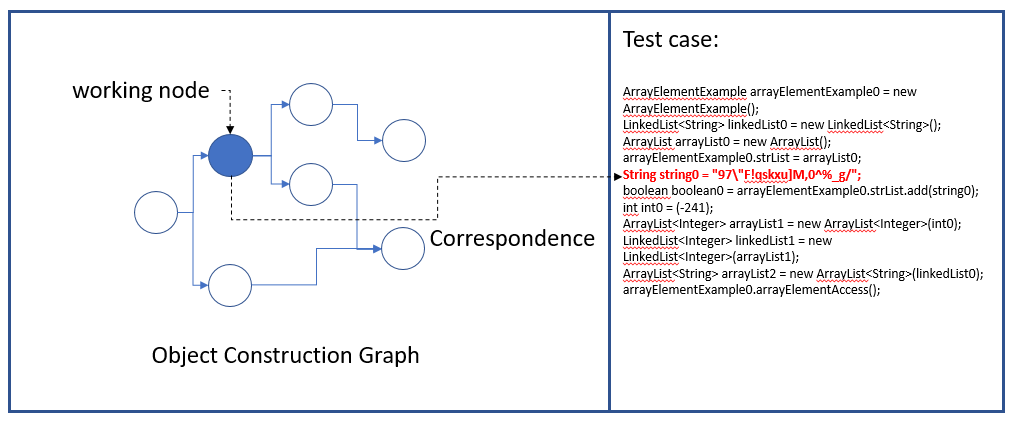
Specifically, we show (1) the object construction graph, (2) the effect of traversing a node on updating the test code, and (3) the correspondence between a node and a test statement and (4) the test code.
Steps:
- record the graph information in json/xml, the final test code generated;
- record stepwise information, i.e., after executing a node, what test code can look like;
- based on the recoded information in 1 and 2, we visualize it with an interactive tool.
https://github.com/llmhyy/evosuite-plus-plus/commits/graph-visualisation
I have added some code to store the relevant information to reconstruct the graph visualisation. The proof of concept can be seen by running feature.objectconstruction.testgeneration.testcase.ProjectGapGraphBasedCodeGenerationTest. The images are as follows:
D:/linyun/test: Images generated from original partial graph D:/linyun/test2: Images generated from the simplified partial graph D:/linyun/test3: Images generated from the deserialized partial graph (serialized form can be found in D:/linyun/)
https://rpouiller.developpez.com/tutoriels/java/generation-diagrammes-uml-avec-umlgraph/ @snajef maybe we can have a try with this library
https://rpouiller.developpez.com/tutoriels/java/generation-diagrammes-uml-avec-umlgraph/ @snajef maybe we can have a try with this library
I took a look at it, it seems the library is more towards generating class or sequence diagrams (UML) rather than computation graphs, so I'm not sure if it's suited for our uses. What do you think?