Linkerd not capturing accurate Request Per Second
What is the issue?
The below workflow will help understand the usecase of linkerd in my environment.
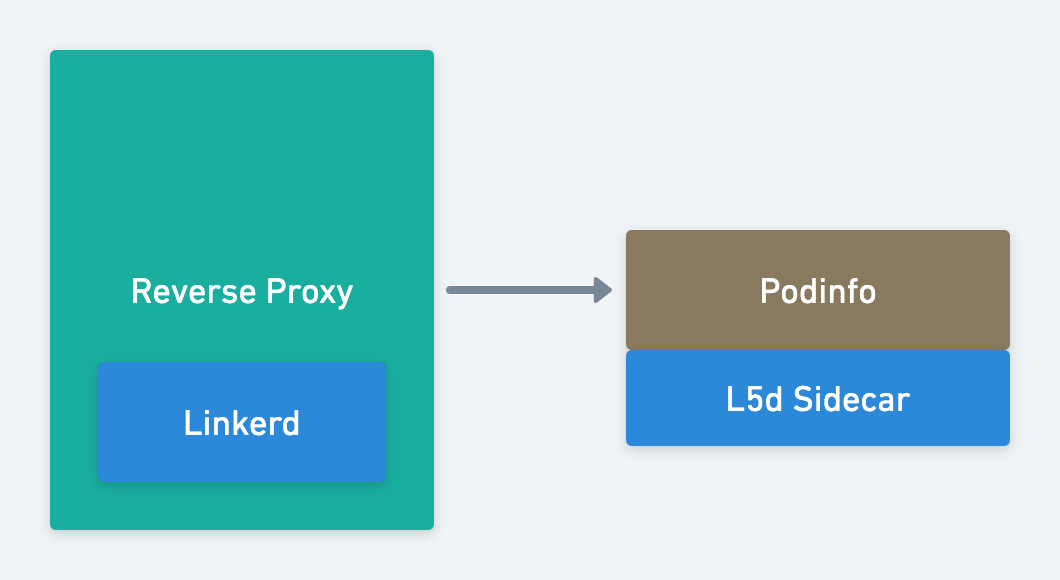
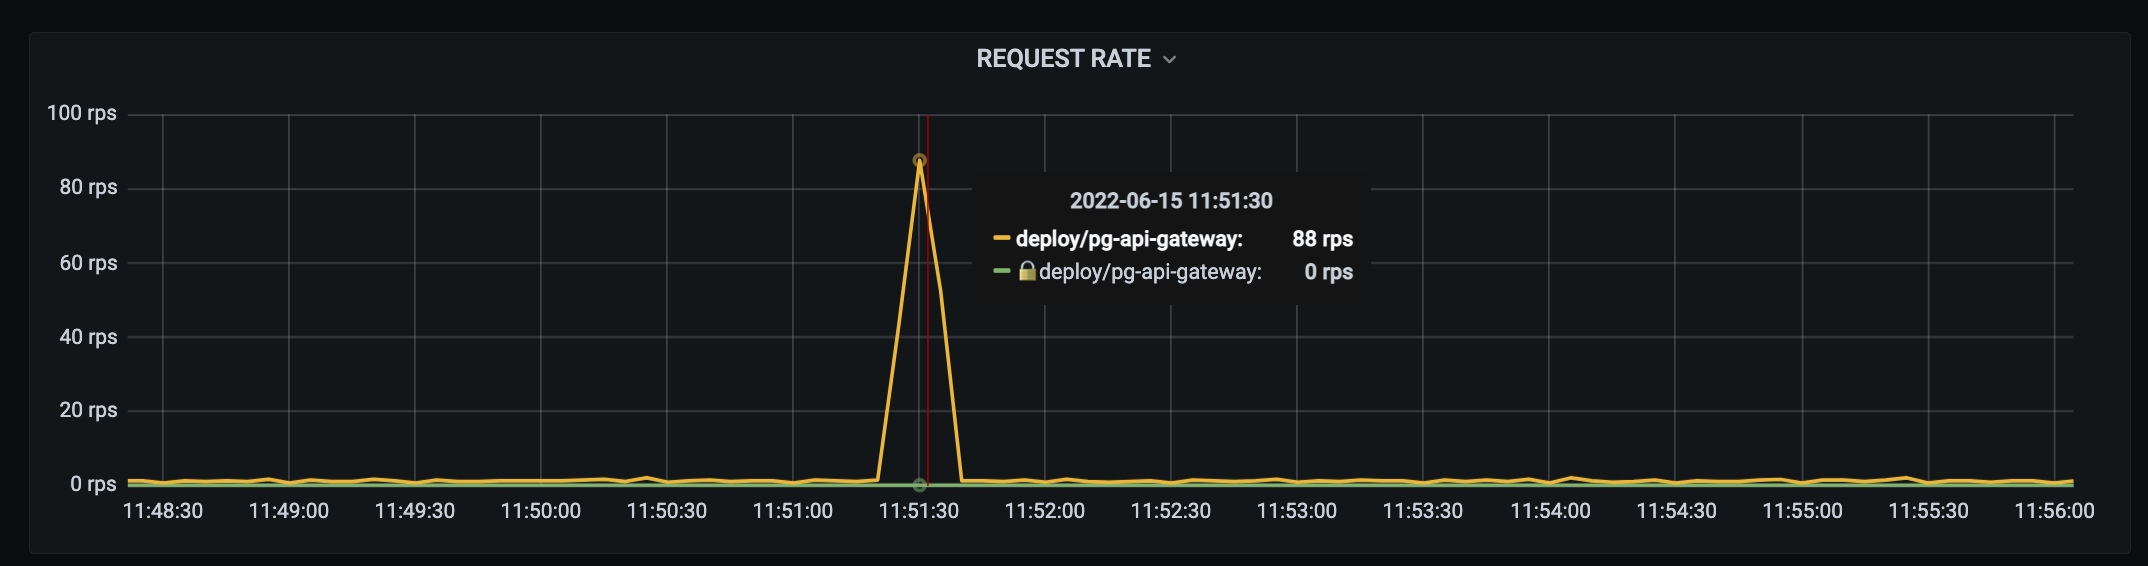
The issue I am seeing is the RPS gap between the reverse proxy actual rate and RPS represented for the same on Linkerd's Grafana dashboard is not matching.
For example, Adding the representation provided by Linkerd on reverse proxy which is receiving request on 100 RPS.
Not sure, is it because of aggregation happening on the prometheus.
How can it be reproduced?
Step:
- Adding linkerd as a side car to a pod.
- Making a loadtest call with specific RPS (for example 100 rps).
- The same RPS should reflect on the Linkerd's Grafana dashboard ie: 100 RPS
Logs, error output, etc
NA
output of linkerd check -o short
Linkerd core checks
===================

linkerd-version
---------------
‼ cli is up-to-date
    is running version 2.11.1 but the latest stable version is 2.11.2
    see https://linkerd.io/2.11/checks/#l5d-version-cli for hints

control-plane-version
---------------------
‼ control plane is up-to-date
    is running version 2.10.2 but the latest stable version is 2.11.2
    see https://linkerd.io/2.11/checks/#l5d-version-control for hints
‼ control plane and cli versions match
    control plane running stable-2.10.2 but cli running stable-2.11.1
    see https://linkerd.io/2.11/checks/#l5d-version-control for hints

linkerd-control-plane-proxy
---------------------------
‼ control plane proxies are up-to-date
    some proxies are not running the current version:
	* linkerd-controller-7c6574cf57-clx6d (stable-2.10.2)
	* linkerd-destination-6f64b64bff-hs5q5 (stable-2.10.2)
	* linkerd-identity-bbc998998-5wxmk (stable-2.10.2)
	* linkerd-proxy-injector-67d474fc8b-vt4s2 (stable-2.10.2)
	* linkerd-sp-validator-5dd49f87bf-z88sb (stable-2.10.2)
    see https://linkerd.io/2.11/checks/#l5d-cp-proxy-version for hints
‼ control plane proxies and cli versions match
    linkerd-controller-7c6574cf57-clx6d running stable-2.10.2 but cli running stable-2.11.1
    see https://linkerd.io/2.11/checks/#l5d-cp-proxy-cli-version for hints

Status check results are √

Linkerd extensions checks
=========================

linkerd-viz
-----------
‼ tap API server cert is valid for at least 60 days
    certificate will expire on 2022-08-05T19:15:33Z
    see https://linkerd.io/2.11/checks/#l5d-tap-cert-not-expiring-soon for hints
‼ viz extension proxies are up-to-date
    some proxies are not running the current version:
	* grafana-79b497d96-9ns5n (stable-2.10.2)
	* metrics-api-d9cc4c779-crwb7 (stable-2.10.2)
	* tap-77794f5949-4kzkp (stable-2.10.2)
	* tap-injector-5fd66f7cbb-qv469 (stable-2.10.2)
	* web-575545678f-7vlhz (stable-2.10.2)
    see https://linkerd.io/2.11/checks/#l5d-viz-proxy-cp-version for hints
‼ viz extension proxies and cli versions match
    grafana-79b497d96-9ns5n running stable-2.10.2 but cli running stable-2.11.1
    see https://linkerd.io/2.11/checks/#l5d-viz-proxy-cli-version for hints

Status check results are √
Environment
- Kubernetes Version: latest
- Provider GCP
Possible solution
NA
Additional context
No response
Would you like to work on fixing this bug?
No response
@afzal-idfy Could you plz explain your load in the details? At least, how much time do you generate the load?
It looks like you do the load for a very short period of time. The scrape config time by default has a 10-second interval, so if you scrape the metrics in some points only (for example on the second where 80 RPS was calculated at that point), then no surprise that you had these results.
This issue has been automatically marked as stale because it has not had recent activity. It will be closed in 14 days if no further activity occurs. Thank you for your contributions.