linkerd-proxy 2.9...2.11 memory consumption
What is the issue?
Currently we are using Linkerd 2.8 on multiple clusters. Trying to update Linkerd to actual version by one version at once.
Updated control plane to version 2.9 - everything works as expected. Then I updated sidecar linkerd-proxy via rollout restart, checked errors, metrics, etc. Most services' proxies works just fine, but few services' proxies started to eat much more memory (5x-10x) in comparison to 2.8 version. For example, one service's 2.9 proxy OOM killed with 256Mb limit, but used only 40-50Mb on version 2.8.
Main difference between those services: "good" services replies with small bodies (few Kb's) and "bad" services replies with 100+ Kb bodies.
Also, problem exist when both "client" and "server" services uses 2.9 version. If client's proxy is 2.8 - servers' proxy memory usage is normal.
Also, the more clients - the more server's proxy will eat memory.
2.10 linkerd-proxy also tested with pretty same results as 2.9. Unable to test 2.11, got OOM in a second after start, maybe incompatible with 2.9 control-plane.
How can it be reproduced?
Server To emulate one of our affected production service, I wrote simple http server, which replies with 128Kb body with 25-100ms delay. Code: https://github.com/zigmund/linkerd-2.9-memory-issue Docker image: zigmund/linkerd-2.9-memory-issue:v1
Client Ubuntu image + siege (but could be any other http load tool)
Steps to reproduce
- Install Linkerd 2.9.
- Deploy server (k8s deployment and service).
- Deploy client (k8s deployment) with linkerd-proxy 2.8.
- Load server with http requests. For example:
siege -c 6 -t 5m http://test-server/slow. Play with different number of clients and siege threads (to keep overall load level same from all clients). - Redeploy client with linkerd-proxy 2.9.
- Redeploy server to reset metrics for clean experiment.
- Load server again and observe much more server's linkerd-proxy memory usage.
Here's my results. I used 1 server instance and 1-3 clients instances.
Client 2.8 -> server 2.9 (yellow line) 1 client - 6 threads - 9.25Mb ram 2 client - 3 threads each - 10.78Mb ram 3 client - 2 threads each - 10.88Mb ram
Client 2.9 -> server 2.9 (green line) 1 client - 6 threads - 17.60Mb 2 client - 3 threads each - 27.32Mb 3 client - 2 threads each - 37.95Mb
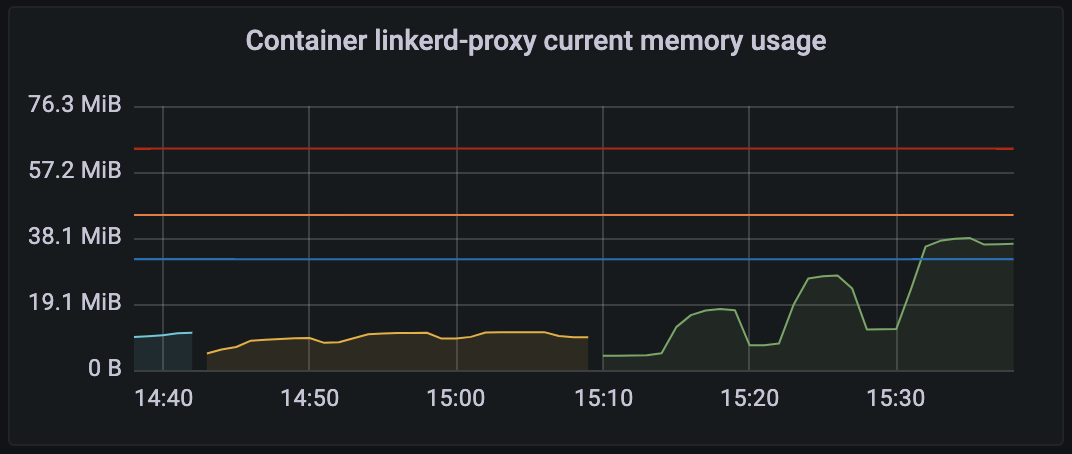
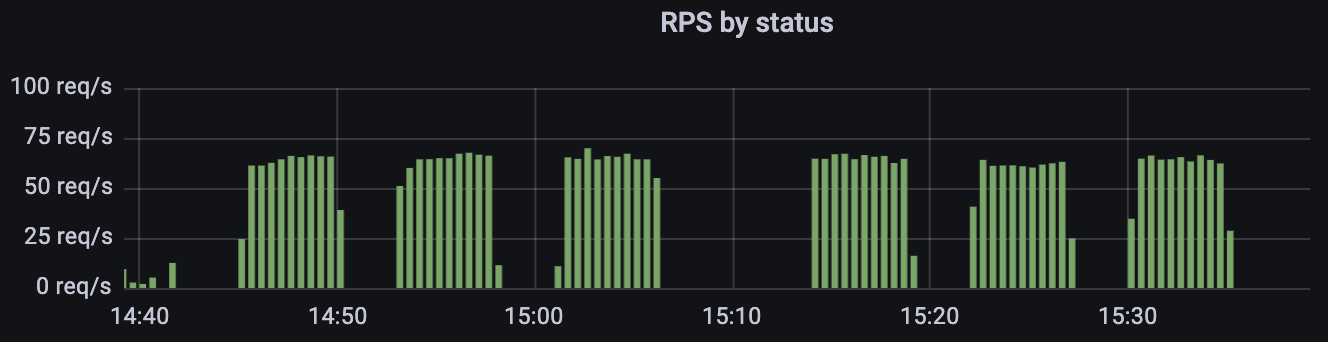
Load was pretty same for all runs - ~65 rps.
Logs, error output, etc
Nothing really interesting... just a normal logs.
Client:
time="2022-01-14T09:06:53Z" level=info msg="running version stable-2.9.4"
[     0.000955s]  INFO ThreadId(01) linkerd2_proxy::rt: Using single-threaded proxy runtime
[     0.001611s]  INFO ThreadId(01) linkerd2_proxy: Admin interface on 0.0.0.0:4191
[     0.001620s]  INFO ThreadId(01) linkerd2_proxy: Inbound interface on 0.0.0.0:4143
[     0.001623s]  INFO ThreadId(01) linkerd2_proxy: Outbound interface on 127.0.0.1:4140
[     0.001625s]  INFO ThreadId(01) linkerd2_proxy: Tap interface on 0.0.0.0:4190
[     0.001627s]  INFO ThreadId(01) linkerd2_proxy: Local identity is default.debug.serviceaccount.identity.linkerd...
[     0.001634s]  INFO ThreadId(01) linkerd2_proxy: Identity verified via linkerd-identity-headless.linkerd.svc...:8080 (linkerd-identity.linkerd.serviceaccount.identity.linkerd...)
[     0.001637s]  INFO ThreadId(01) linkerd2_proxy: Destinations resolved via linkerd-dst-headless.linkerd.svc...:8086 (linkerd-destination.linkerd.serviceaccount.identity.linkerd...)
[     0.001874s]  INFO ThreadId(01) outbound: linkerd2_app: listen.addr=127.0.0.1:4140 ingress_mode=false
[     0.001946s]  INFO ThreadId(01) inbound: linkerd2_app: listen.addr=0.0.0.0:4143
[     0.015292s]  INFO ThreadId(02) daemon:identity: linkerd2_app: Certified identity: default.debug.serviceaccount.identity.linkerd...
[   703.542318s]  INFO ThreadId(01) outbound:accept{peer.addr=10.252.65.193:60624 target.addr=10.251.68.226:80}: linkerd2_app_core::serve: Connection closed error=connection closed before message completed
...
Server:
time="2022-01-14T12:08:35Z" level=info msg="running version stable-2.9.4"
[     0.023549s]  INFO ThreadId(01) linkerd2_proxy::rt: Using single-threaded proxy runtime
[     0.043906s]  INFO ThreadId(01) linkerd2_proxy: Admin interface on 0.0.0.0:4191
[     0.043917s]  INFO ThreadId(01) linkerd2_proxy: Inbound interface on 0.0.0.0:4143
[     0.043919s]  INFO ThreadId(01) linkerd2_proxy: Outbound interface on 127.0.0.1:4140
[     0.043922s]  INFO ThreadId(01) linkerd2_proxy: Tap interface on 0.0.0.0:4190
[     0.043941s]  INFO ThreadId(01) linkerd2_proxy: Local identity is default.debug.serviceaccount.identity.linkerd...
[     0.045033s]  INFO ThreadId(01) linkerd2_proxy: Identity verified via linkerd-identity-headless.linkerd.svc...:8080 (linkerd-identity.linkerd.serviceaccount.identity.linkerd...)
[     0.045037s]  INFO ThreadId(01) linkerd2_proxy: Destinations resolved via linkerd-dst-headless.linkerd.svc...:8086 (linkerd-destination.linkerd.serviceaccount.identity.linkerd...)
[     0.059020s]  INFO ThreadId(01) outbound: linkerd2_app: listen.addr=127.0.0.1:4140 ingress_mode=false
[     0.062906s]  INFO ThreadId(01) inbound: linkerd2_app: listen.addr=0.0.0.0:4143
[     0.095113s]  INFO ThreadId(02) daemon:identity: linkerd2_app: Certified identity: default.debug.serviceaccount.identity.linkerd...
...
output of linkerd check -o short
kubernetes-api
--------------
√ can initialize the client
√ can query the Kubernetes API

kubernetes-version
------------------
√ is running the minimum Kubernetes API version
√ is running the minimum kubectl version

linkerd-existence
-----------------
√ 'linkerd-config' config map exists
√ heartbeat ServiceAccount exist
√ control plane replica sets are ready
√ no unschedulable pods
√ controller pod is running
√ can initialize the client
√ can query the control plane API

linkerd-config
--------------
√ control plane Namespace exists
√ control plane ClusterRoles exist
√ control plane ClusterRoleBindings exist
√ control plane ServiceAccounts exist
W0114 17:38:41.283706   92427 warnings.go:67] apiextensions.k8s.io/v1beta1 CustomResourceDefinition is deprecated in v1.16+, unavailable in v1.22+; use apiextensions.k8s.io/v1 CustomResourceDefinition
√ control plane CustomResourceDefinitions exist
W0114 17:38:41.336825   92427 warnings.go:67] admissionregistration.k8s.io/v1beta1 MutatingWebhookConfiguration is deprecated in v1.16+, unavailable in v1.22+; use admissionregistration.k8s.io/v1 MutatingWebhookConfiguration
√ control plane MutatingWebhookConfigurations exist
W0114 17:38:41.354391   92427 warnings.go:67] admissionregistration.k8s.io/v1beta1 ValidatingWebhookConfiguration is deprecated in v1.16+, unavailable in v1.22+; use admissionregistration.k8s.io/v1 ValidatingWebhookConfiguration
√ control plane ValidatingWebhookConfigurations exist
√ control plane PodSecurityPolicies exist

linkerd-identity
----------------
√ certificate config is valid
√ trust anchors are using supported crypto algorithm
√ trust anchors are within their validity period
√ trust anchors are valid for at least 60 days
√ issuer cert is using supported crypto algorithm
√ issuer cert is within its validity period
√ issuer cert is valid for at least 60 days
√ issuer cert is issued by the trust anchor

linkerd-webhooks-and-apisvc-tls
-------------------------------
√ tap API server has valid cert
√ tap API server cert is valid for at least 60 days
W0114 17:38:41.523149   92427 warnings.go:67] admissionregistration.k8s.io/v1beta1 MutatingWebhookConfiguration is deprecated in v1.16+, unavailable in v1.22+; use admissionregistration.k8s.io/v1 MutatingWebhookConfiguration
√ proxy-injector webhook has valid cert
√ proxy-injector cert is valid for at least 60 days
W0114 17:38:41.573368   92427 warnings.go:67] admissionregistration.k8s.io/v1beta1 ValidatingWebhookConfiguration is deprecated in v1.16+, unavailable in v1.22+; use admissionregistration.k8s.io/v1 ValidatingWebhookConfiguration
√ sp-validator webhook has valid cert
√ sp-validator cert is valid for at least 60 days

linkerd-api
-----------
√ control plane pods are ready
√ control plane self-check
√ [kubernetes] control plane can talk to Kubernetes
√ [prometheus] control plane can talk to Prometheus
√ tap api service is running

linkerd-version
---------------
√ can determine the latest version
‼ cli is up-to-date
    is running version 2.9.4 but the latest stable version is 2.11.1
    see https://linkerd.io/checks/#l5d-version-cli for hints

control-plane-version
---------------------
‼ control plane is up-to-date
    is running version 2.9.4 but the latest stable version is 2.11.1
    see https://linkerd.io/checks/#l5d-version-control for hints
√ control plane and cli versions match
W0114 17:38:42.406838   92427 warnings.go:67] admissionregistration.k8s.io/v1beta1 MutatingWebhookConfiguration is deprecated in v1.16+, unavailable in v1.22+; use admissionregistration.k8s.io/v1 MutatingWebhookConfiguration

linkerd-ha-checks
-----------------
√ multiple replicas of control plane pods

linkerd-grafana
---------------
√ grafana add-on service account exists
√ grafana add-on config map exists
√ grafana pod is running

Status check results are √
Environment
- Kubernetes Version: v1.20.5
- Cluster Environment: Baremetal
- Host OS: Ubuntu 20.04 (kernel 5.4.0 / 5.8.0)
- Linkerd version: 2.9.4
Possible solution
No response
Additional context
No response
Would you like to work on fixing this bug?
maybe
@zigmund Are you able to test the most recent stable version (2.11.1)? There were a number of changes in this release that could improve memory usage, notably moving from the system allocator to jemalloc.
@olix0r I'll check it on test cluster. But it looks like regression in 2.9.
Also there is another question... Is 2.11 control plane compatible with 2.8 proxy? Or maybe 2.10 control plane compatible with 2.11 and 2.8 proxies? And are 2.11 and 2.8 proxies compatible?
What am talking about right now - updating production clusters. It will be really hard and slow to uninstall linkerd, redeploy all workload, install 2.11 and redeploy all workload again, since we have many meshed services in few clusters. It will be not good to stay without linkerd for a time.
Hey @zigmund, Like @olix0r mentioned, would highly recommend running on the recent versions as a lot changes happened since 2.9.
Is 2.11 control plane compatible with 2.8 proxy? Or maybe 2.10 control plane compatible with 2.11 and 2.8 proxies? And are 2.11 and 2.8 proxies compatible?
Running a different major versions of the control-plane and data-plane is not recommended. As logics change between major changes, and there could be undefined behavior causing problems. During upgrades, We recommend users updating the data-plane proxies as soon as they upgrade control-plane. We don't provide compatibility guarantees across major versions (both btw cp & dp, and btw proxies).
updating production clusters. It will be really hard and slow to uninstall linkerd, redeploy all workload, install 2.11 and redeploy all workload again, since we have many meshed services in few clusters. It will be not good to stay without linkerd for a time.
For the upgrade paths, We generally suggest upgrading the control-plane followed by a roll-out on the applications. This should be fine. 🤔
I'm fairly sure that the memory consumption should be fixed with latest versions as we have seen that being the case with other issues but happy to know what's happening if it does not go away after upgrades. :)
Thanks
@olix0r, @Pothulapati
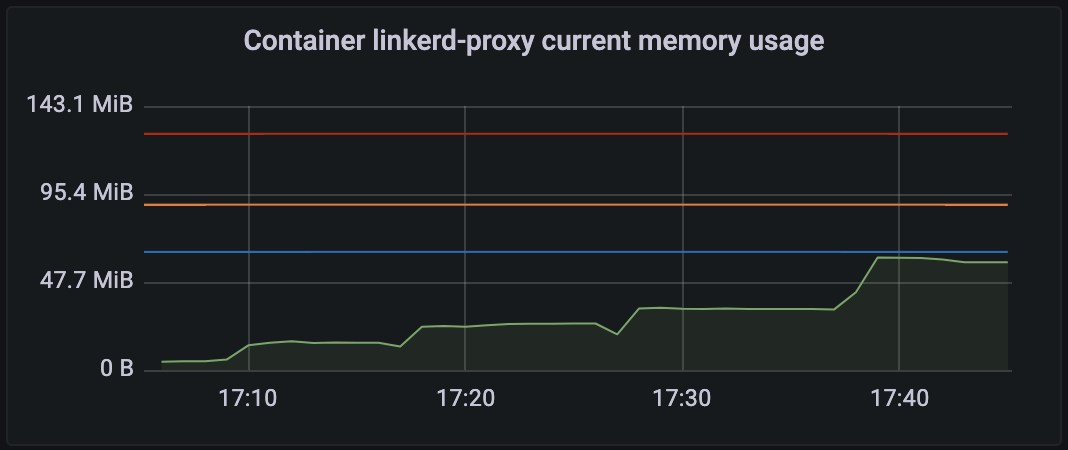
I've tested 2.11.1 and results are almost the same. Slightly better than 2.9 & 2.10, but much more worse than 2.8.
2.11.1
test case                 | memory usage
1 client - 6 threads      | 15.55Mb
2 client - 3 threads each | 24.97Mb
3 client - 2 threads each | 33.72Mb
6 client - 1 threads each | 60.95Mb
More clients - significantly more memory usage:
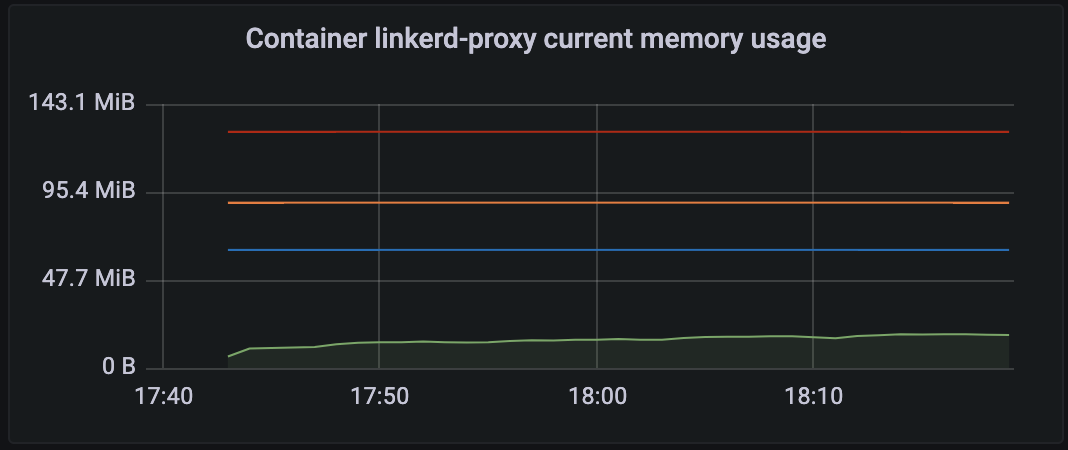
2.8.1
test case                 | memory usage
1 client - 6 threads      | 14.33Mb
2 client - 3 threads each | 15.73Mb
3 client - 2 threads each | 17.27Mb
6 client - 1 threads each | 18.32Mb
You barely can see the difference in memory usage between test runs:
@zigmund slightly off the topic, how did you get the memory usage of the linkerd-proxy. I am trying to check both cpu utilisation and memory usage of the linkerd-proxy with the pre-configured Grafana dashboard, under Linkerd health but I just can't find it. Any ideas? thanks
@ezemegwara it's container_memory_working_set_bytes and container_cpu_usage_seconds_total metrics series, exported by kubelet (cadvisor). Info: https://kubernetes.io/docs/concepts/cluster-administration/system-metrics/
This issue has been automatically marked as stale because it has not had recent activity. It will be closed in 14 days if no further activity occurs. Thank you for your contributions.
This issue has been automatically marked as stale because it has not had recent activity. It will be closed in 14 days if no further activity occurs. Thank you for your contributions.
Beep
Hi @zigmund. Resource usage in the proxy is complex and depends on a large number of factors including size of the cluster, request load, and the exact nature of the traffic. It's certainly likely that the resource consumption properties of the proxy have changed significantly between 2.9 and 2.11 because the functionality and structure of the proxy have changed significantly in that time.
In the future we'd like to have more tools for being able to predict and control proxy memory use, but we don't have those today. In the meantime, this issue is not really actionable.
This issue has been automatically marked as stale because it has not had recent activity. It will be closed in 14 days if no further activity occurs. Thank you for your contributions.